SWS survey says 40% of Filipinos Feel Their Life Worsened Compared to Last Year
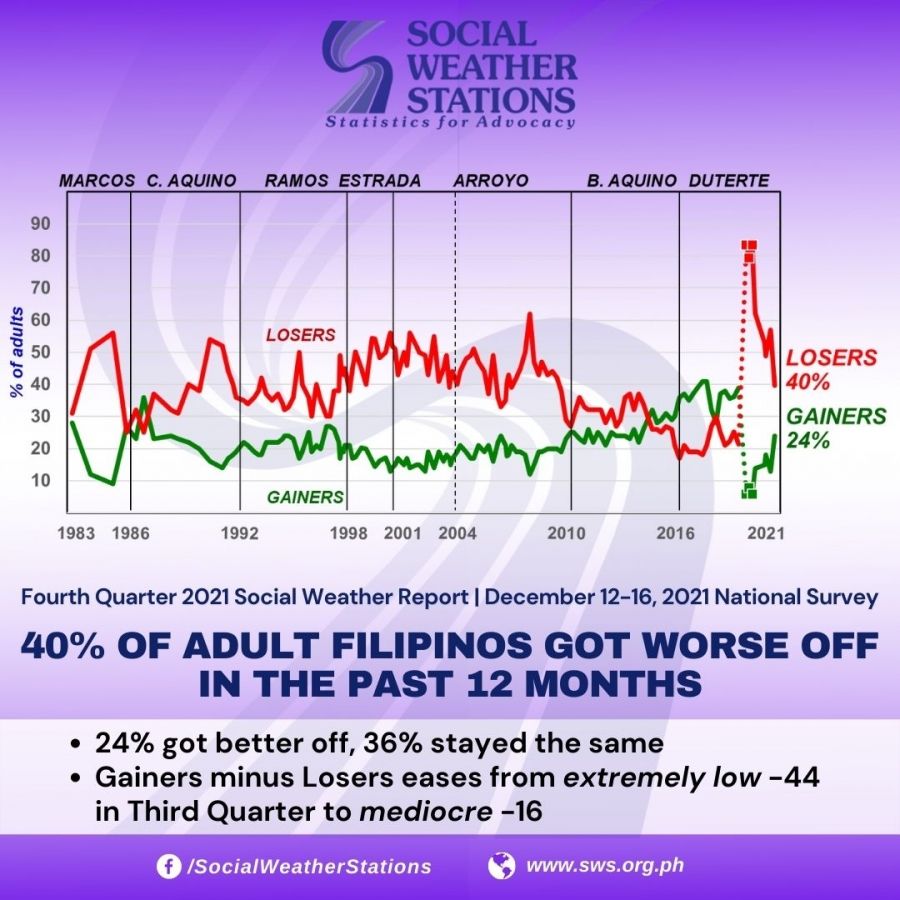
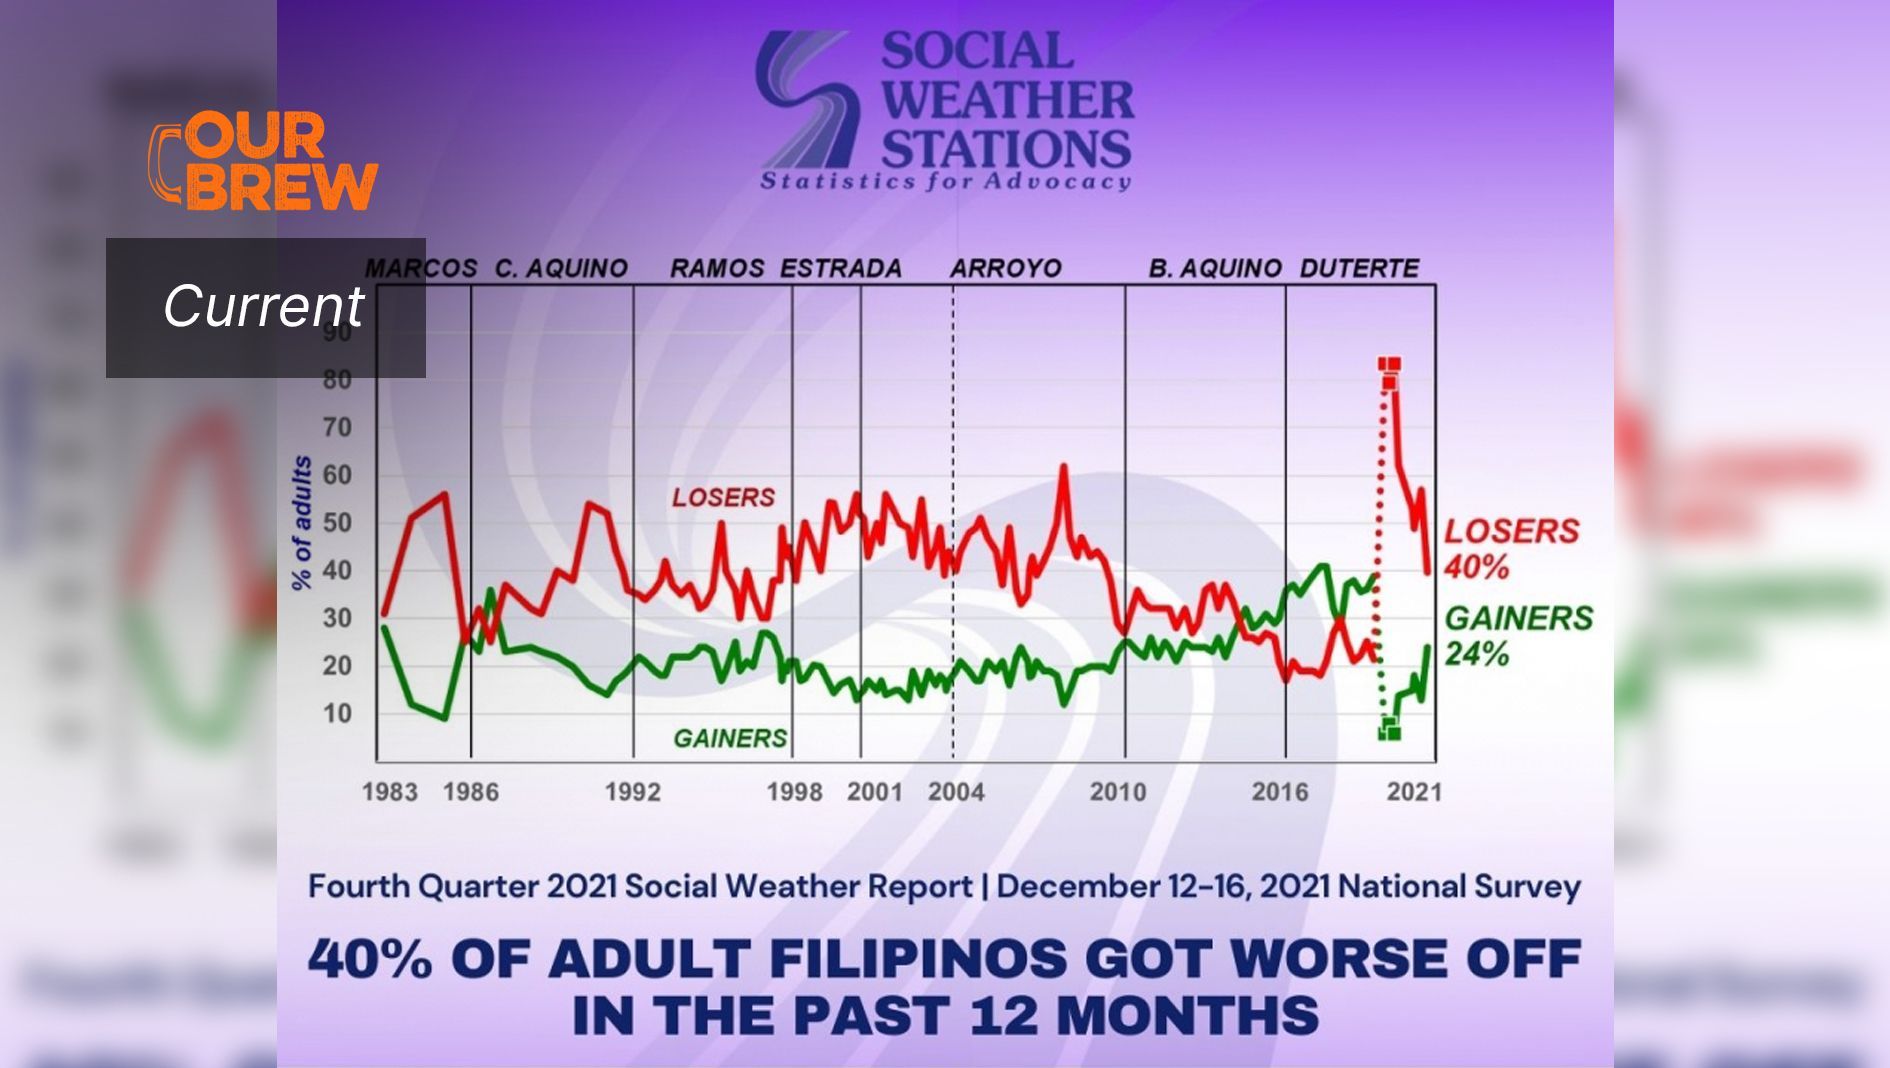
Fourth Quarter 2021 Social Weather Survey: 40% of adult Filipinos got worse off in the past 12 months
by Social Weather Stations
- 24% got better off, 36% stayed the same
- Gainers minus Losers eases from extremely low -44 in Third Quarter to mediocre -16
The national Social Weather Survey of December 12-16, 2021, found 40% of adult Filipinos saying their quality-of-life was worse than twelve months before (termed by SWS as “Losers”), 24% saying it got better (“Gainers”), and 36% saying it was the same (“Unchanged”), compared to a year ago [Chart 1].
The resulting Net Gainers score is -16 (% Gainers minus % Losers), classified by SWS as mediocre (-19 to -10) [Chart 2, Table 1].
The December 2021 Net Gainer score is 28 points up from the extremely low -44 in September 2021, but still 34 points below the pre-pandemic level of the very high +18 in December 2019.
The survey question on the respondents’ assessment of their change in quality-of-life in the past 12 months has been fielded 143 times since April 1983.
Net Gainers eases in all areas: very low in the Visayas, mediocre elsewhere
The 28-point rise in the national Net Gainer score between September 2021 and December 2021 was due to improvements in all areas, especially in Metro Manila and Mindanao.
Compared to September 2021, Net Gainers eased from catastrophic to mediocre in Metro Manila, up by 40 points from -51 to -11 [Chart 3, Table 2].
It eased from extremely low to mediocre in Mindanao, up by 32 points from -47 to -15.
It also eased from extremely low to mediocre in Balance Luzon, up by 30 points from -41 to -11.
It eased from extremely low to very low in the Visayas, up by 15 points from -46 to -31.
Net Gainers eases for all education groups
Compared to September 2021, Net Gainers eased from extremely low to mediocre among non-elementary graduates, up by 27 points from -46 to -19 [Chart 4, Table 3].
It eased from catastrophic to mediocre among elementary graduates, up by 33 points from -50 to -17.
It eased from extremely low to mediocre among junior high school graduates, up by 29 points from -46 to -17.
It eased from low to fair among college graduates, up by 19 points from -26 to -7.
SWS classifications
The following are the classifications of Net Gainers scores: The grade “Excellent” is applied to scores at +20 and above; “Very High” to scores between +10 and +19; “High” to scores between +1 and +9; “Fair” to scores between –9 and zero; “Mediocre” to scores between –19 and –10; “Low” to scores between –29 and –20; “Very Low” to scores between –39 and –30; “Extremely Low” to scores at –49 to –40; and “Catastrophic” to scores –50 and below. (Up to December 2019, “Very Low” was the bottom-most category and was applied to scores –30 and below. In the course of the Covid-19 pandemic, new negative categories were delineated. In May 2020, the grade “Extremely Low” was added and applied to scores –40 and below; and in August 2020, the grade of “Catastrophic” was added for those scores below –50.)
The historical distribution of Net Gainers scores by grade is summarized in the table below:
Net Gainers | |||
Range | Classification | Number of surveys | % of surveys |
+20 and above | Excellent | 2 | 1 |
+10 to +19 | Very high | 11 | 8 |
+ 1 to + 9 | High | 8 | 6 |
– 9 to zero | Fair | 23 | 16 |
–19 to –10 | Mediocre | 31 | 22 |
–29 to –20 | Low | 33 | 23 |
–39 to –30 | Very Low | 24 | 17 |
–49 to –40 | Extremely Low | 7 | 5 |
–50 and below | Catastrophic | 4 | 3 |
Total from Apr 1983 – Dec 2021: | 143 | 100% | |
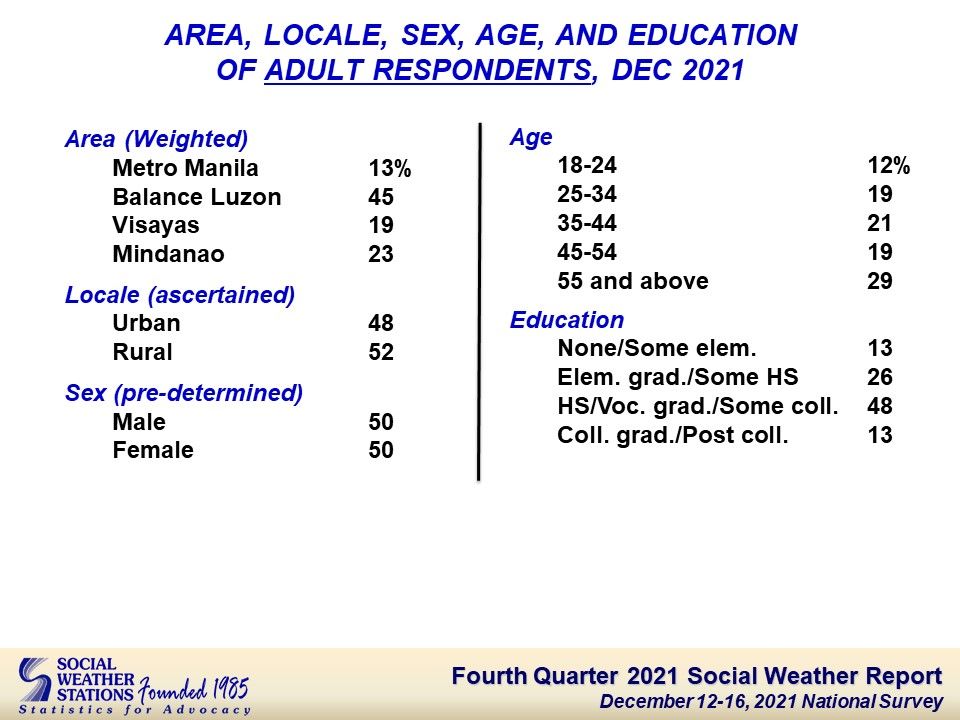
Socio-demographic characteristics of respondents
Applying census weights, 13% of the respondents are from Metro Manila, 45% from Balance Luzon (or Luzon outside Metro Manila), 19% from the Visayas, and 23% from Mindanao [Table 4].
Forty-eight percent are from urban areas, and the balance of 52% are from rural areas.
Male and female respondents have a 1 to 1 ratio, and thus, are alternately sampled.
By age group, 12% are youth (18-24), 19% are intermediate youth (25-34), 21% are middle-aged (35-44), 19% are 45 to 54 years old, and 29% are 55 years old and above.
By education, 13% had at most some elementary education, 26% either finished elementary or had some high school education, 48% either finished high school, completed vocational school, or attended some college, and 13% either graduated from college or took post-graduate studies.
Survey background
The Fourth Quarter 2021 Social Weather Survey was conducted from December 12-16, 2021, using face-to-face interviews of 1,440 adults (18 years old and above) nationwide: 360 each in Balance Luzon, Metro Manila, the Visayas, and Mindanao. Face-to-face is the standard interviewing method for Social Weather Stations; the only exceptions were early in the pandemic when movement restrictions made face-to-face impossible and mobile phone interviews were conducted. Normal face-to-face field operations resumed in November 2020. The sampling error margins are ±2.6% for national percentages and ±5.2% for Balance Luzon, Metro Manila, the Visayas, and Mindanao.
The area estimates were weighted by the Philippine Statistics Authority medium-population projections for 2021 to obtain the national estimates.
The SWS survey question on the change in personal quality-of-life from last year ago to the present is directed towards the probability respondent. This item is non-commissioned and is included on SWS’s initiative and released as a public service.
The findings were first presented at the annual SWS Survey Review on February 7, 2022.
The exact phrasing of the survey questions (the source language is Filipino; English translation included) was:
“Kung ikukumpara ang uri ng inyong kasalukuyang pamumuhay sa nakaraang 12 buwan, masasabi ba ninyo na ang uri ng inyong pamumuhay ay MAS MABUTI KAYSA NOON, KAPAREHO NG DATI, o MAS MASAMA KAYSA NOON? [Comparing your quality of life these days to how it was 12 months ago, would you say that your quality of life is BETTER NOW THAN BEFORE, SAME AS BEFORE, or WORSE NOW THAN BEFORE?]”
SWS employs its own staff for questionnaire design, sampling, fieldwork, data processing, and analysis, and does not outsource any of its survey operations. This report was prepared by Leo S. Laroza and Marvin R. Ipac.
Chart 1
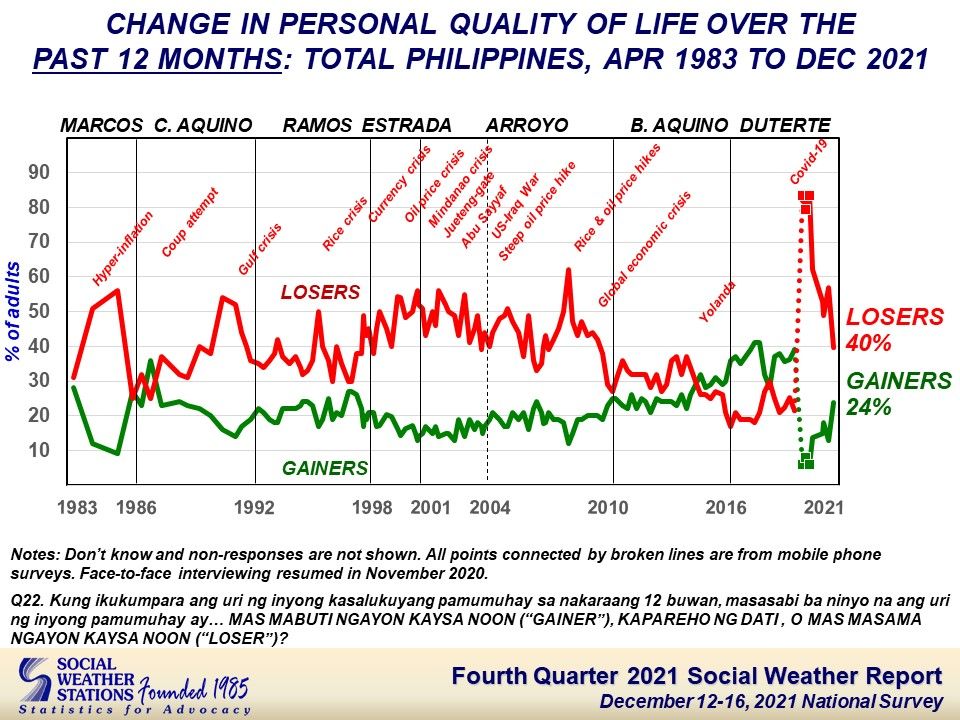
Chart 2
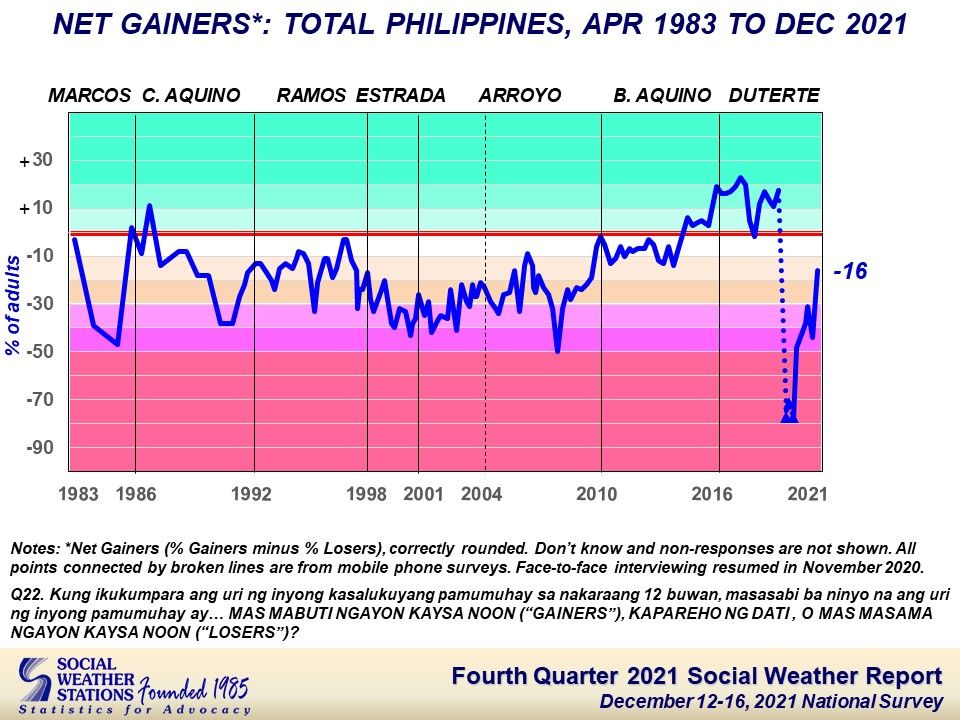
Chart 3
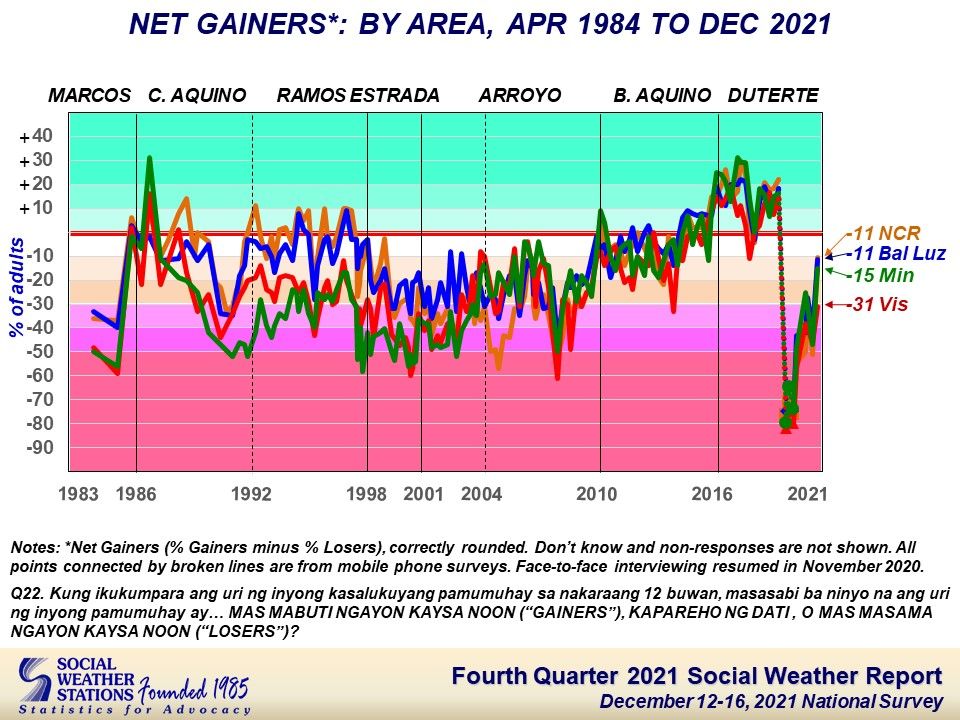
Chart 4
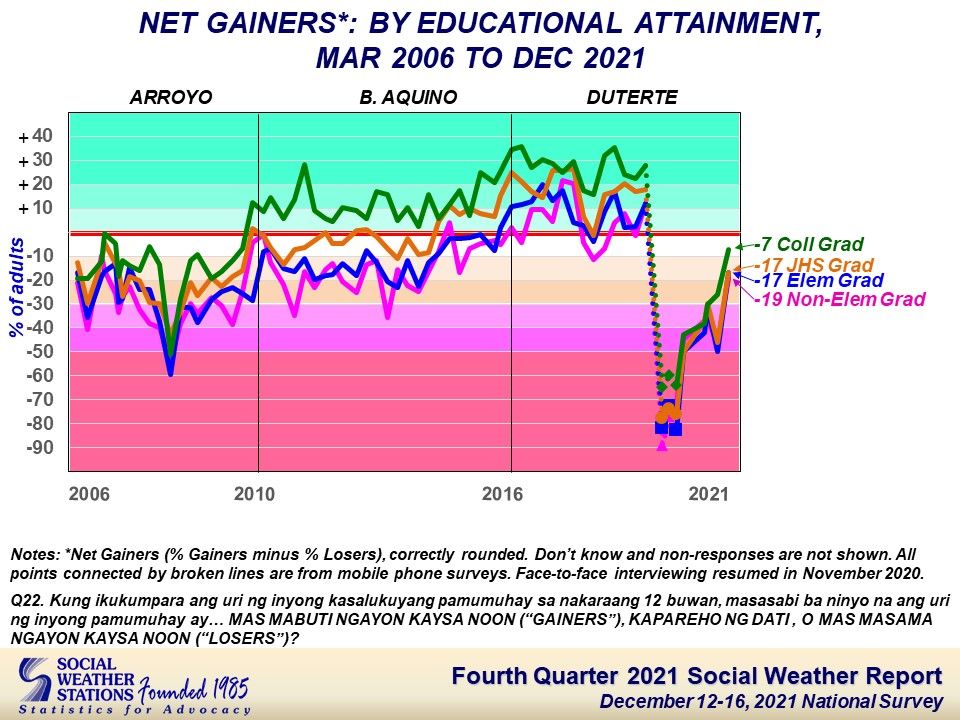
Table 1
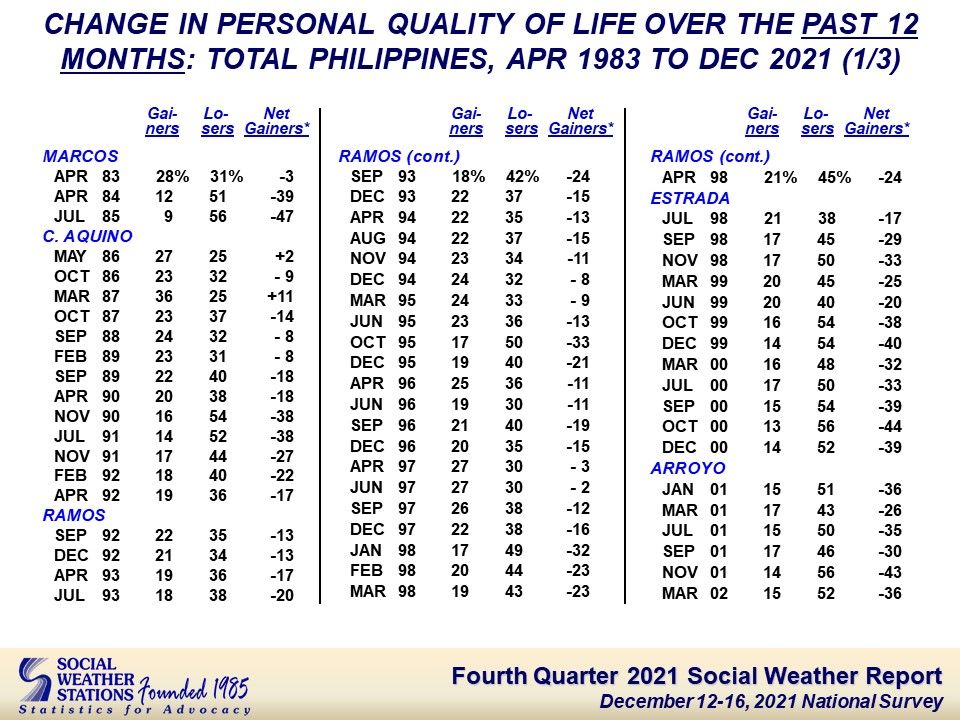
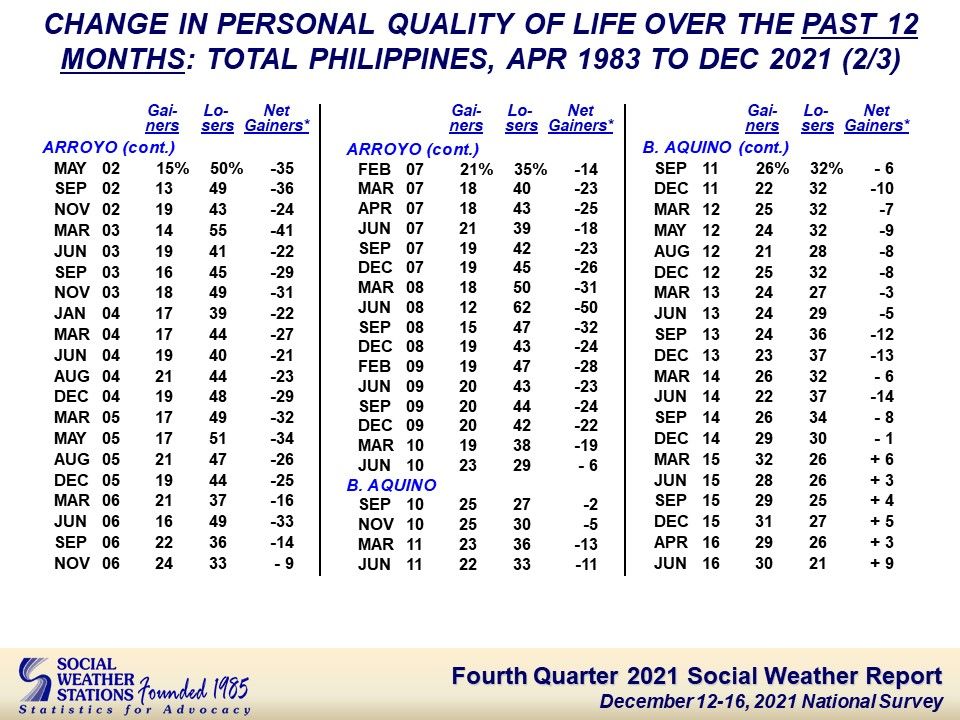
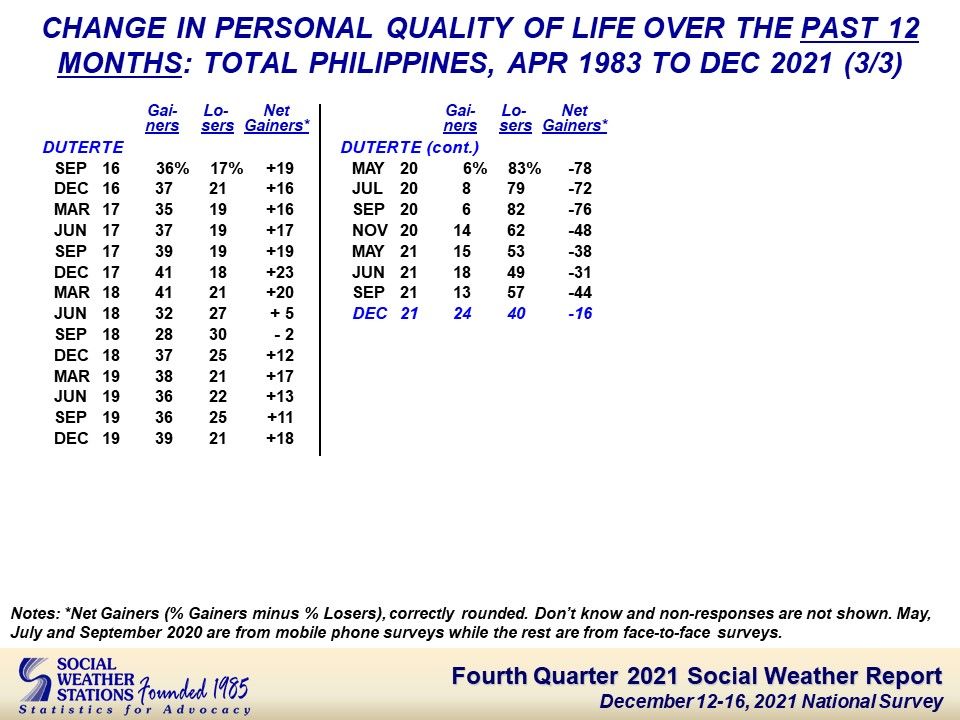
Table 2
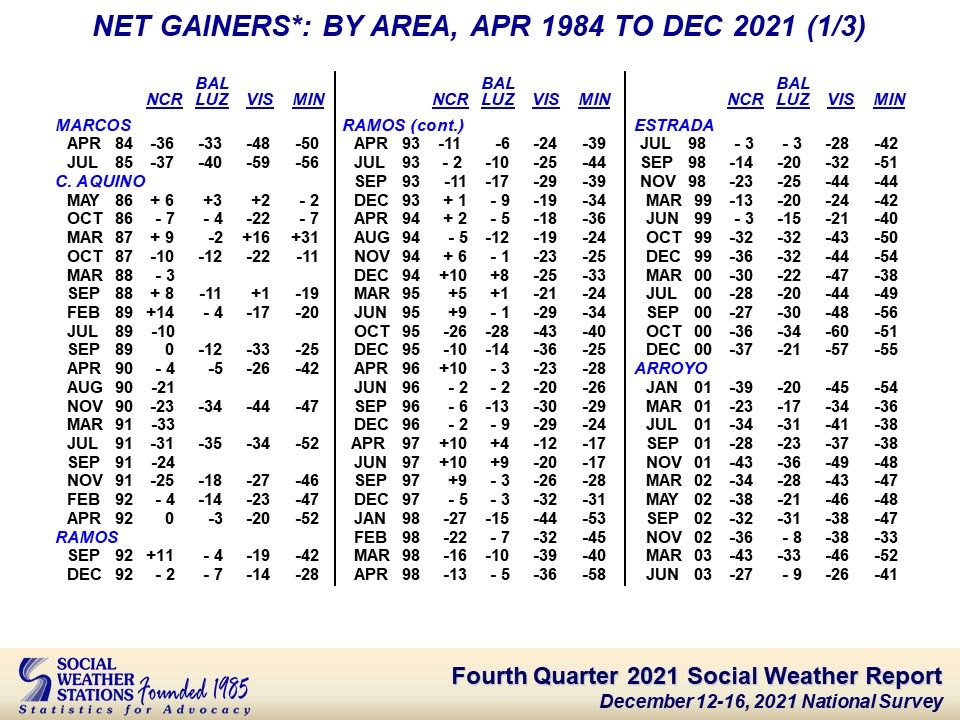
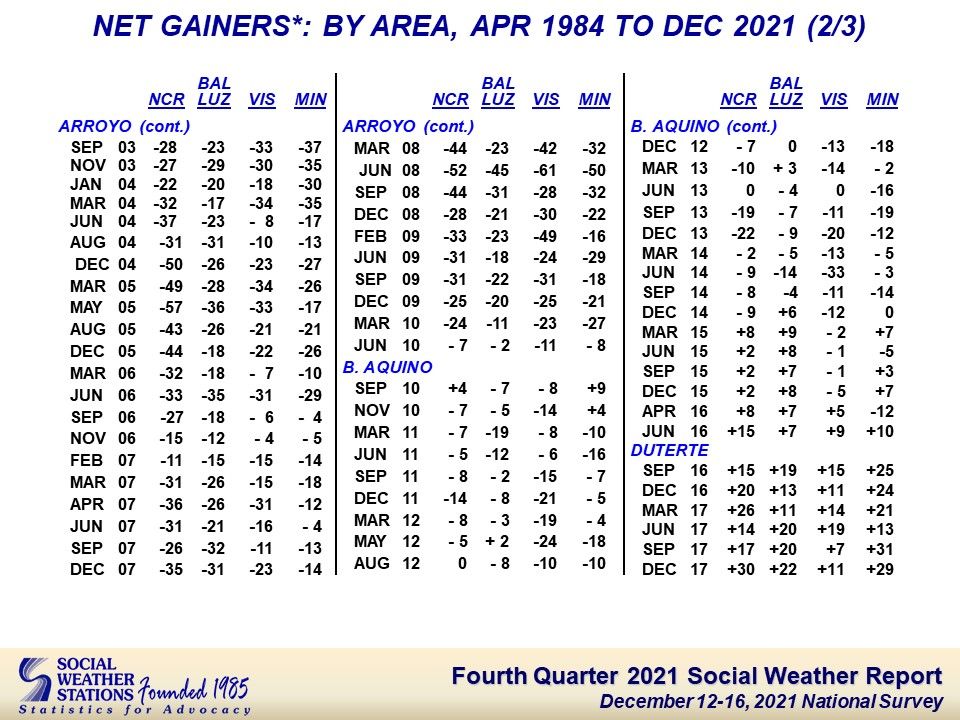
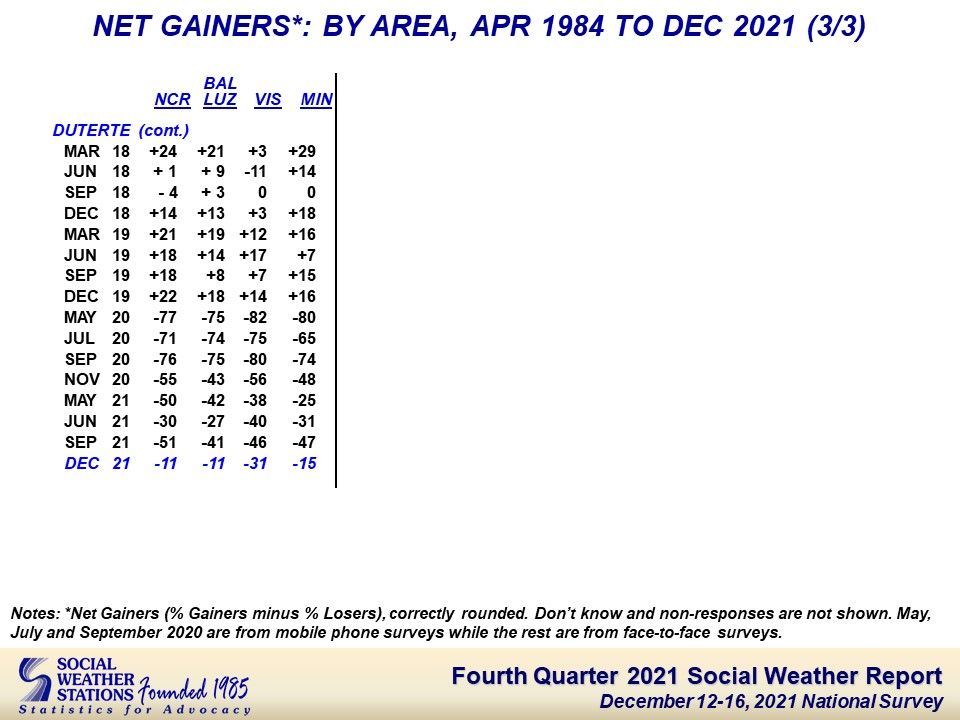
Table 3
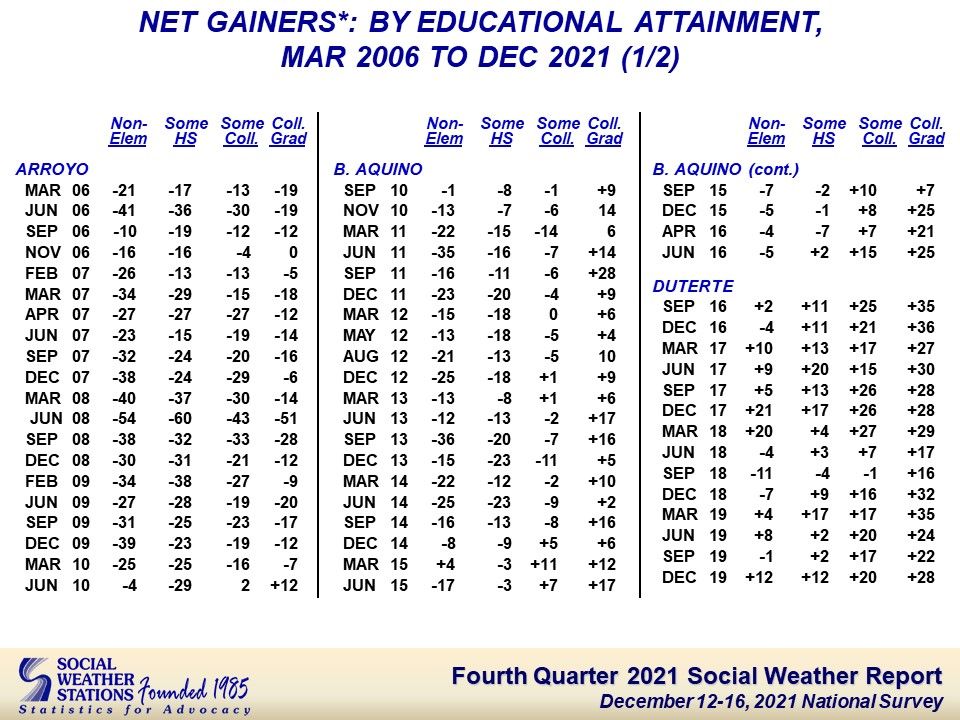
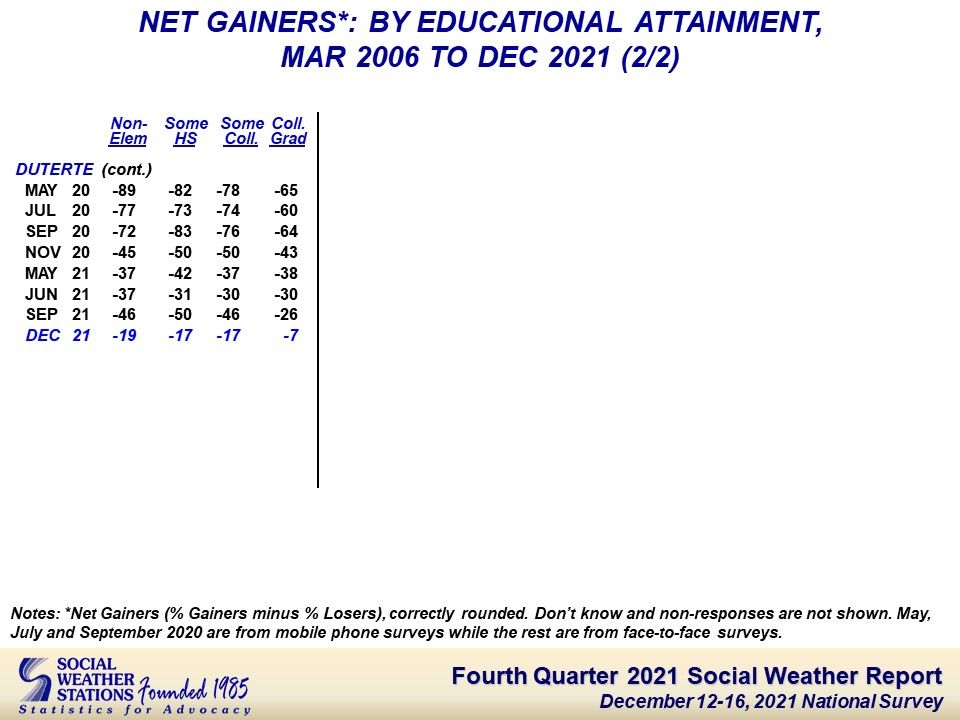
Table 4
If you liked what you just read and want more of Our Brew, subscribe to get notified. Just enter your email below.
Related Posts
Net satisfaction with the Marcos Administration fell to -13 in March 2026 from +14 in November 2025 - SWS
Jun 22, 2026
Massacre of Trees Under a Climate Crisis is Not Development — Greenpeace and NAPC-VDC
Jun 01, 2026
A Mass Killing in the Philippines Sparks Rare Scrutiny Over Counterinsurgency Violence – But No Wider Reckoning
May 31, 2026