By Ronald D. Holmes
President
Pulse Asia Research Inc.
We are pleased to share the results of our May 6 to 9, 2025 Pulso ng Bayan survey. As in previous election cycles, Pulse Asia Research, Inc. conducts its own surveys closer to election day, particularly when the last publicly released results are dated too far in advance. However, due to the time required to encode and process the data, the results of these pre-election surveys are not released publicly. Instead, they are used internally to assess any potential shifts in voting preferences as election day approaches.
Using multi-stage sampling, the May 2025 survey was conducted through face-to-face interviews with 1,200 adult Filipinos who were registered and likely to vote. The technical details of the survey are found in the accompanying General Report.
At the time of the survey, voters selected an average of eight (8) candidates for the Senate. The mean number of candidates chosen varied across regions:
• National Capital Region: 9
• Balance of Luzon: 7
• Visayas: 9
• Mindanao: 10
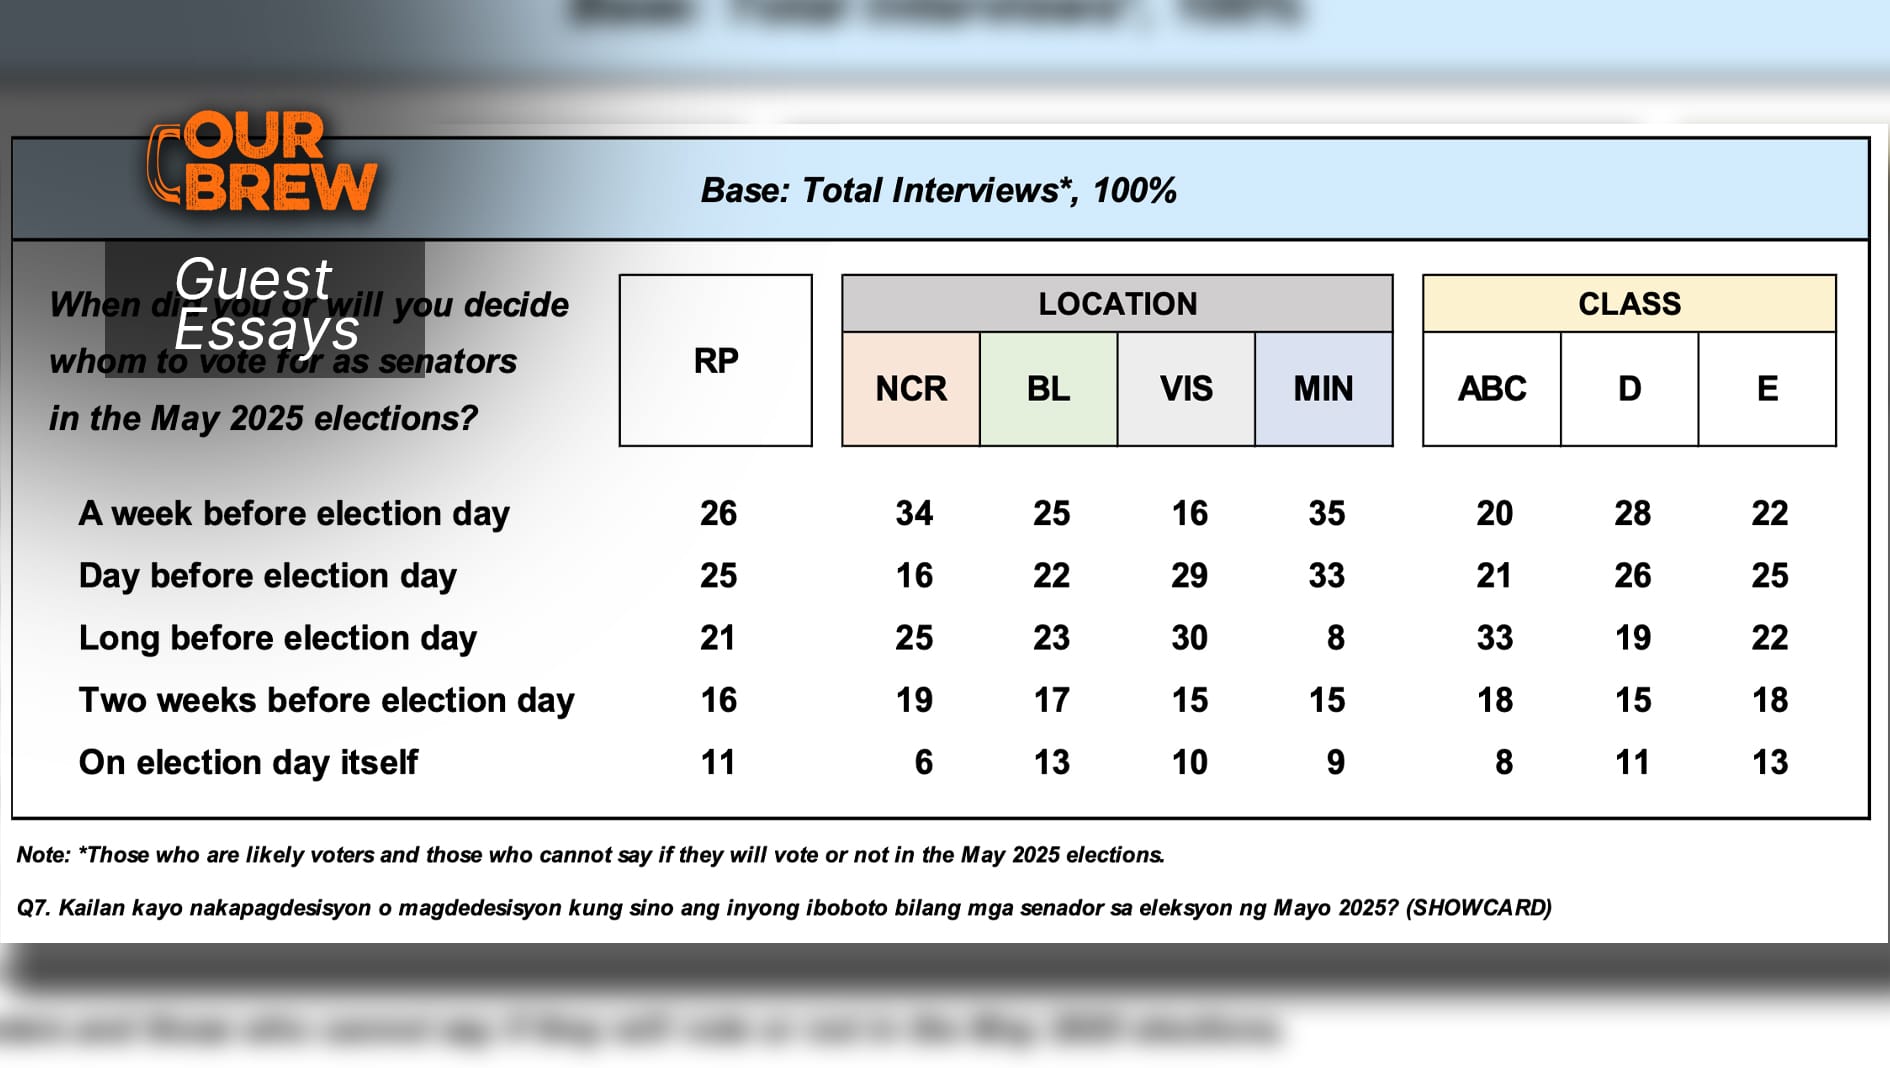
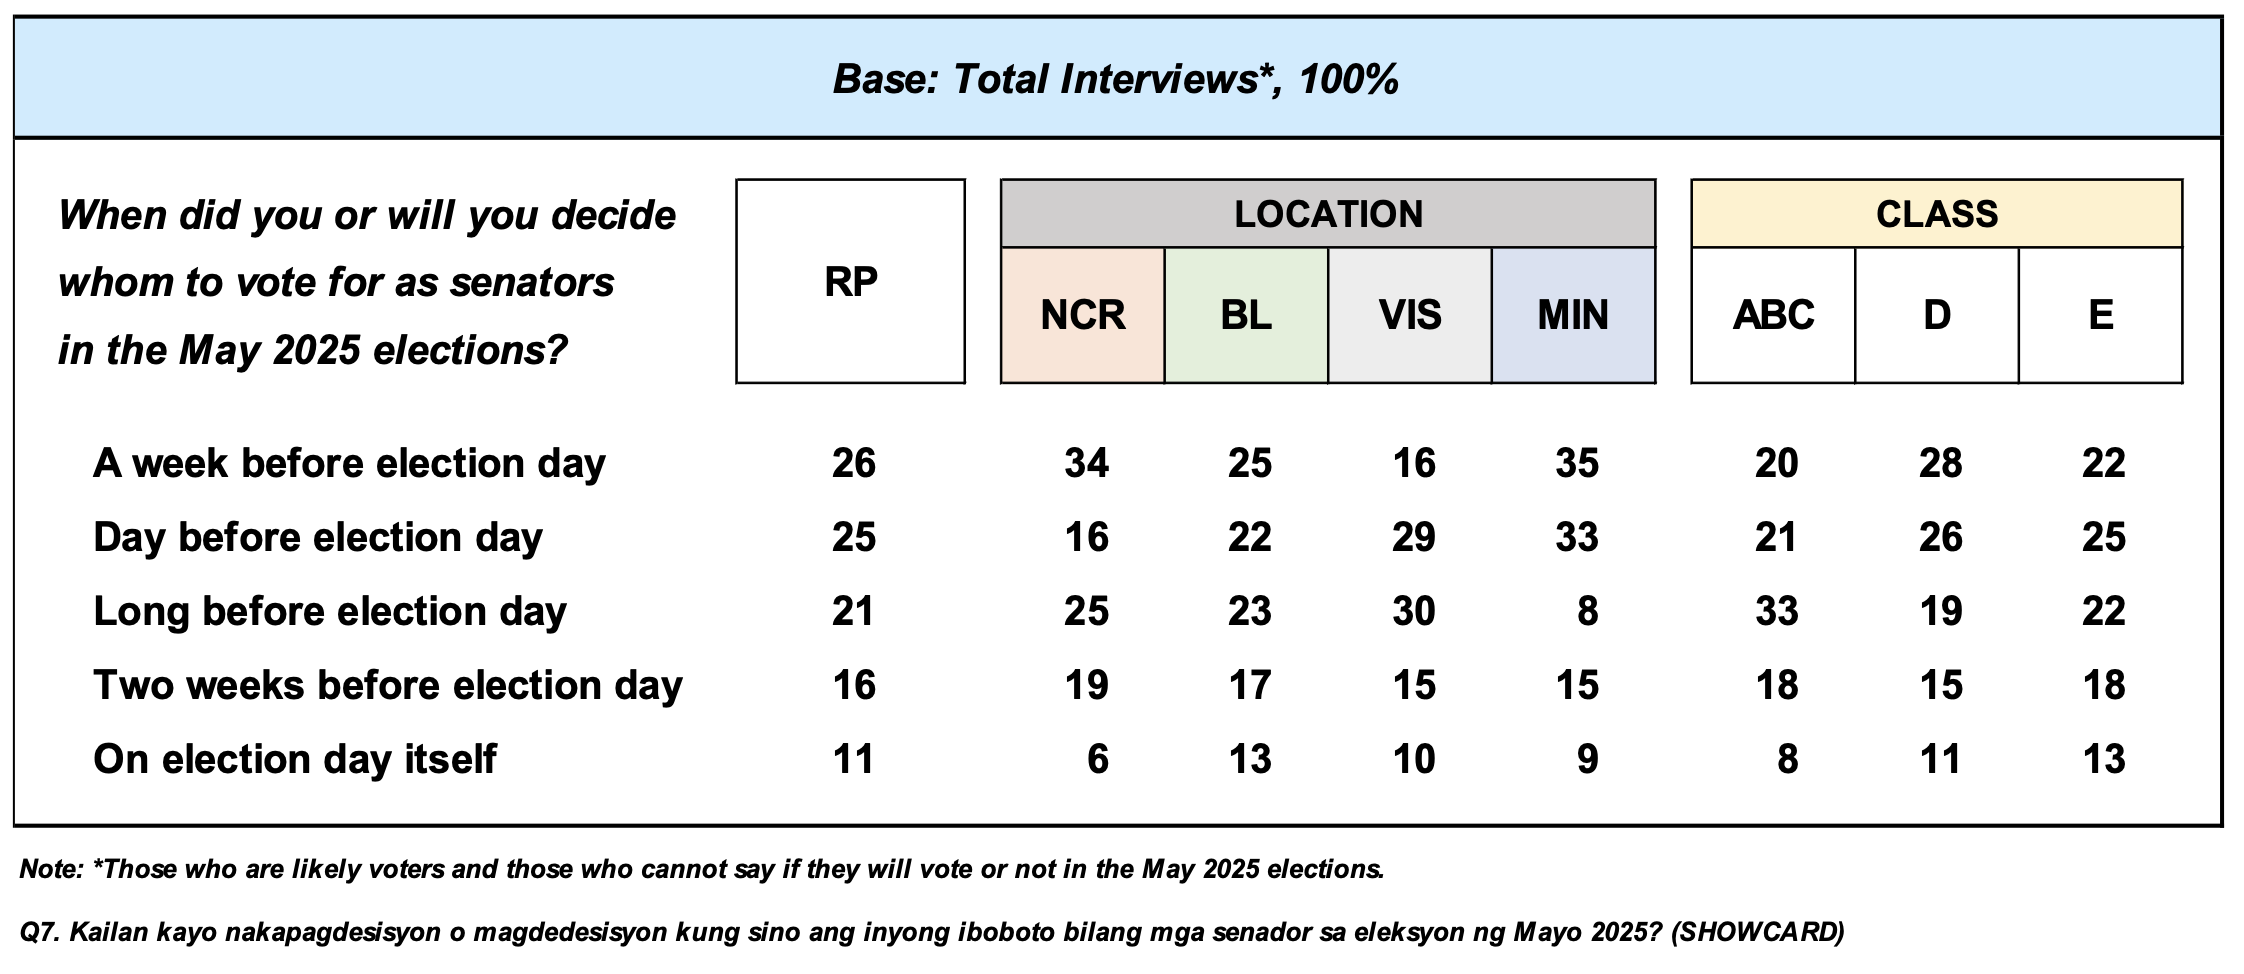
When asked when they decided—or plan to decide—whom to vote for as senators, responses were almost evenly split between those who decided a week before election day (26%) and those who decided the day before (25%). About 21% said they made their decision long before election day, while 16% decided two weeks before, and 11% decided on election day itself.
Table 1. Period of Time in Deciding Whom To Vote for As Senator in the May 2025 Elections
May 6 - 9, 2025 / Philippines
(In Percent)

These figures suggest that over one-third of voters—those who planned to decide the day before (25%) or on election day itself (11%)—were potentially open to last-minute shifts in candidate support.
The survey results show that out of the 64 senatorial candidates, 19 were seriously in competition for the 12 available seats. That is to say, their share of the prospective votes a week before the elections gave them a statistical chance of landing in the winning circle. (Refer to the General Report for the complete list of senatorial candidates.) These 19 candidates are as shown in Table 2.
Table 2. Candidates in Contention in May 2025 Pulso ng Bayan Survey
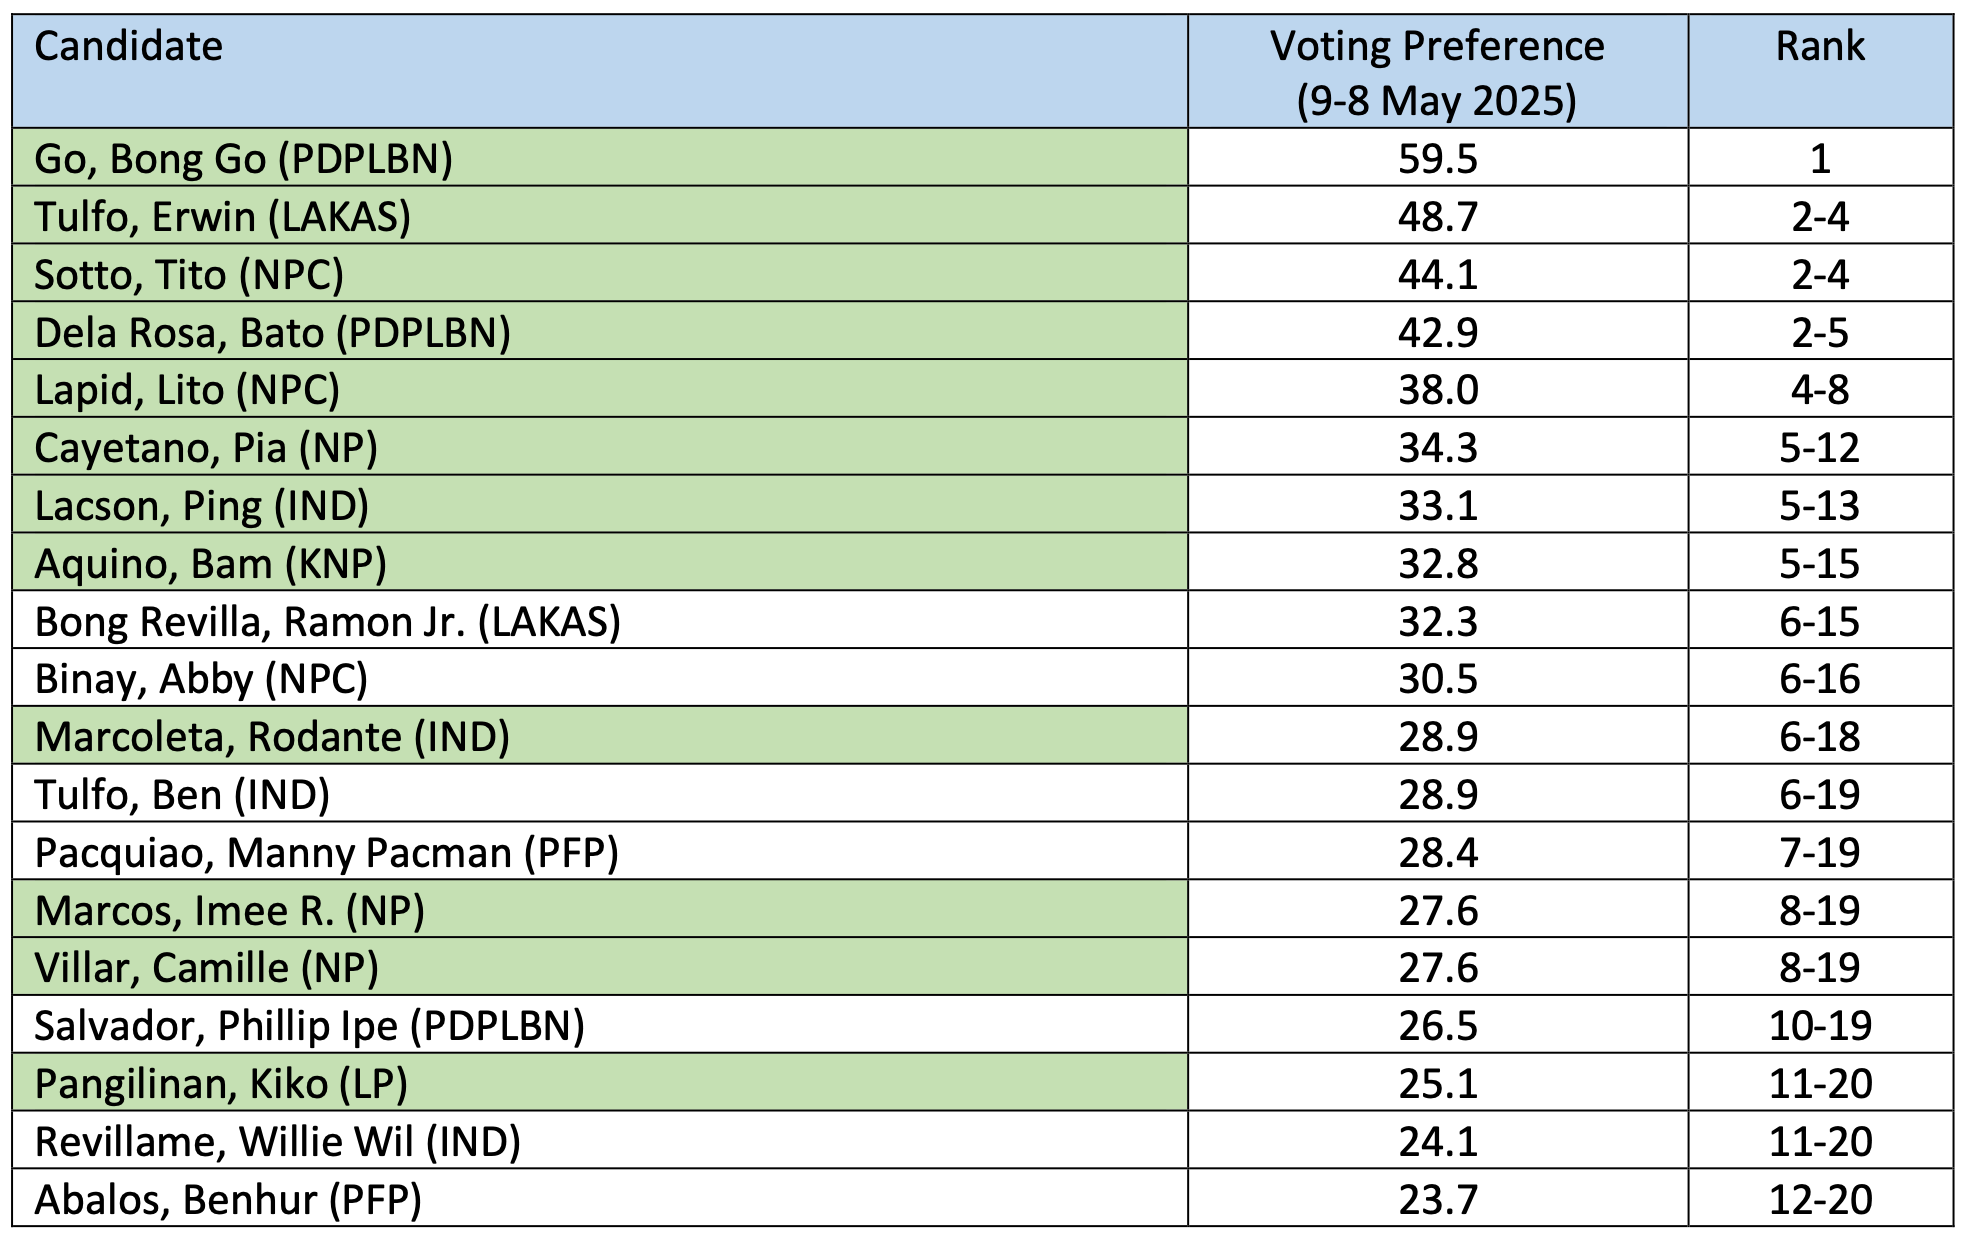
All the ultimate election winners (as indicated by the shaded cells) were among those with statistical chances of winning as of a week before elections. Eight of these ultimate winners also landed at the top of the May survey. Notably, however, is the close margin implied in the voting pattern. The vote share of an ultimate winner, such as Aquino (32.8 percent), was not statistically different from that of a lower-ranked non-winner, like Revilla (32.3 percent). These small differences are even more pronounced in the case of the lower-ranked candidates.
A comparison of the vote shares from the May 2025 Pulso ng Bayan survey, the April 2025 survey, and the actual election results reveals that voter preferences for some candidates shifted markedly over time, particularly as election day approached.
Table 3. Pre-election preference and final share of votes for candidates in contention in the May 2025 survey
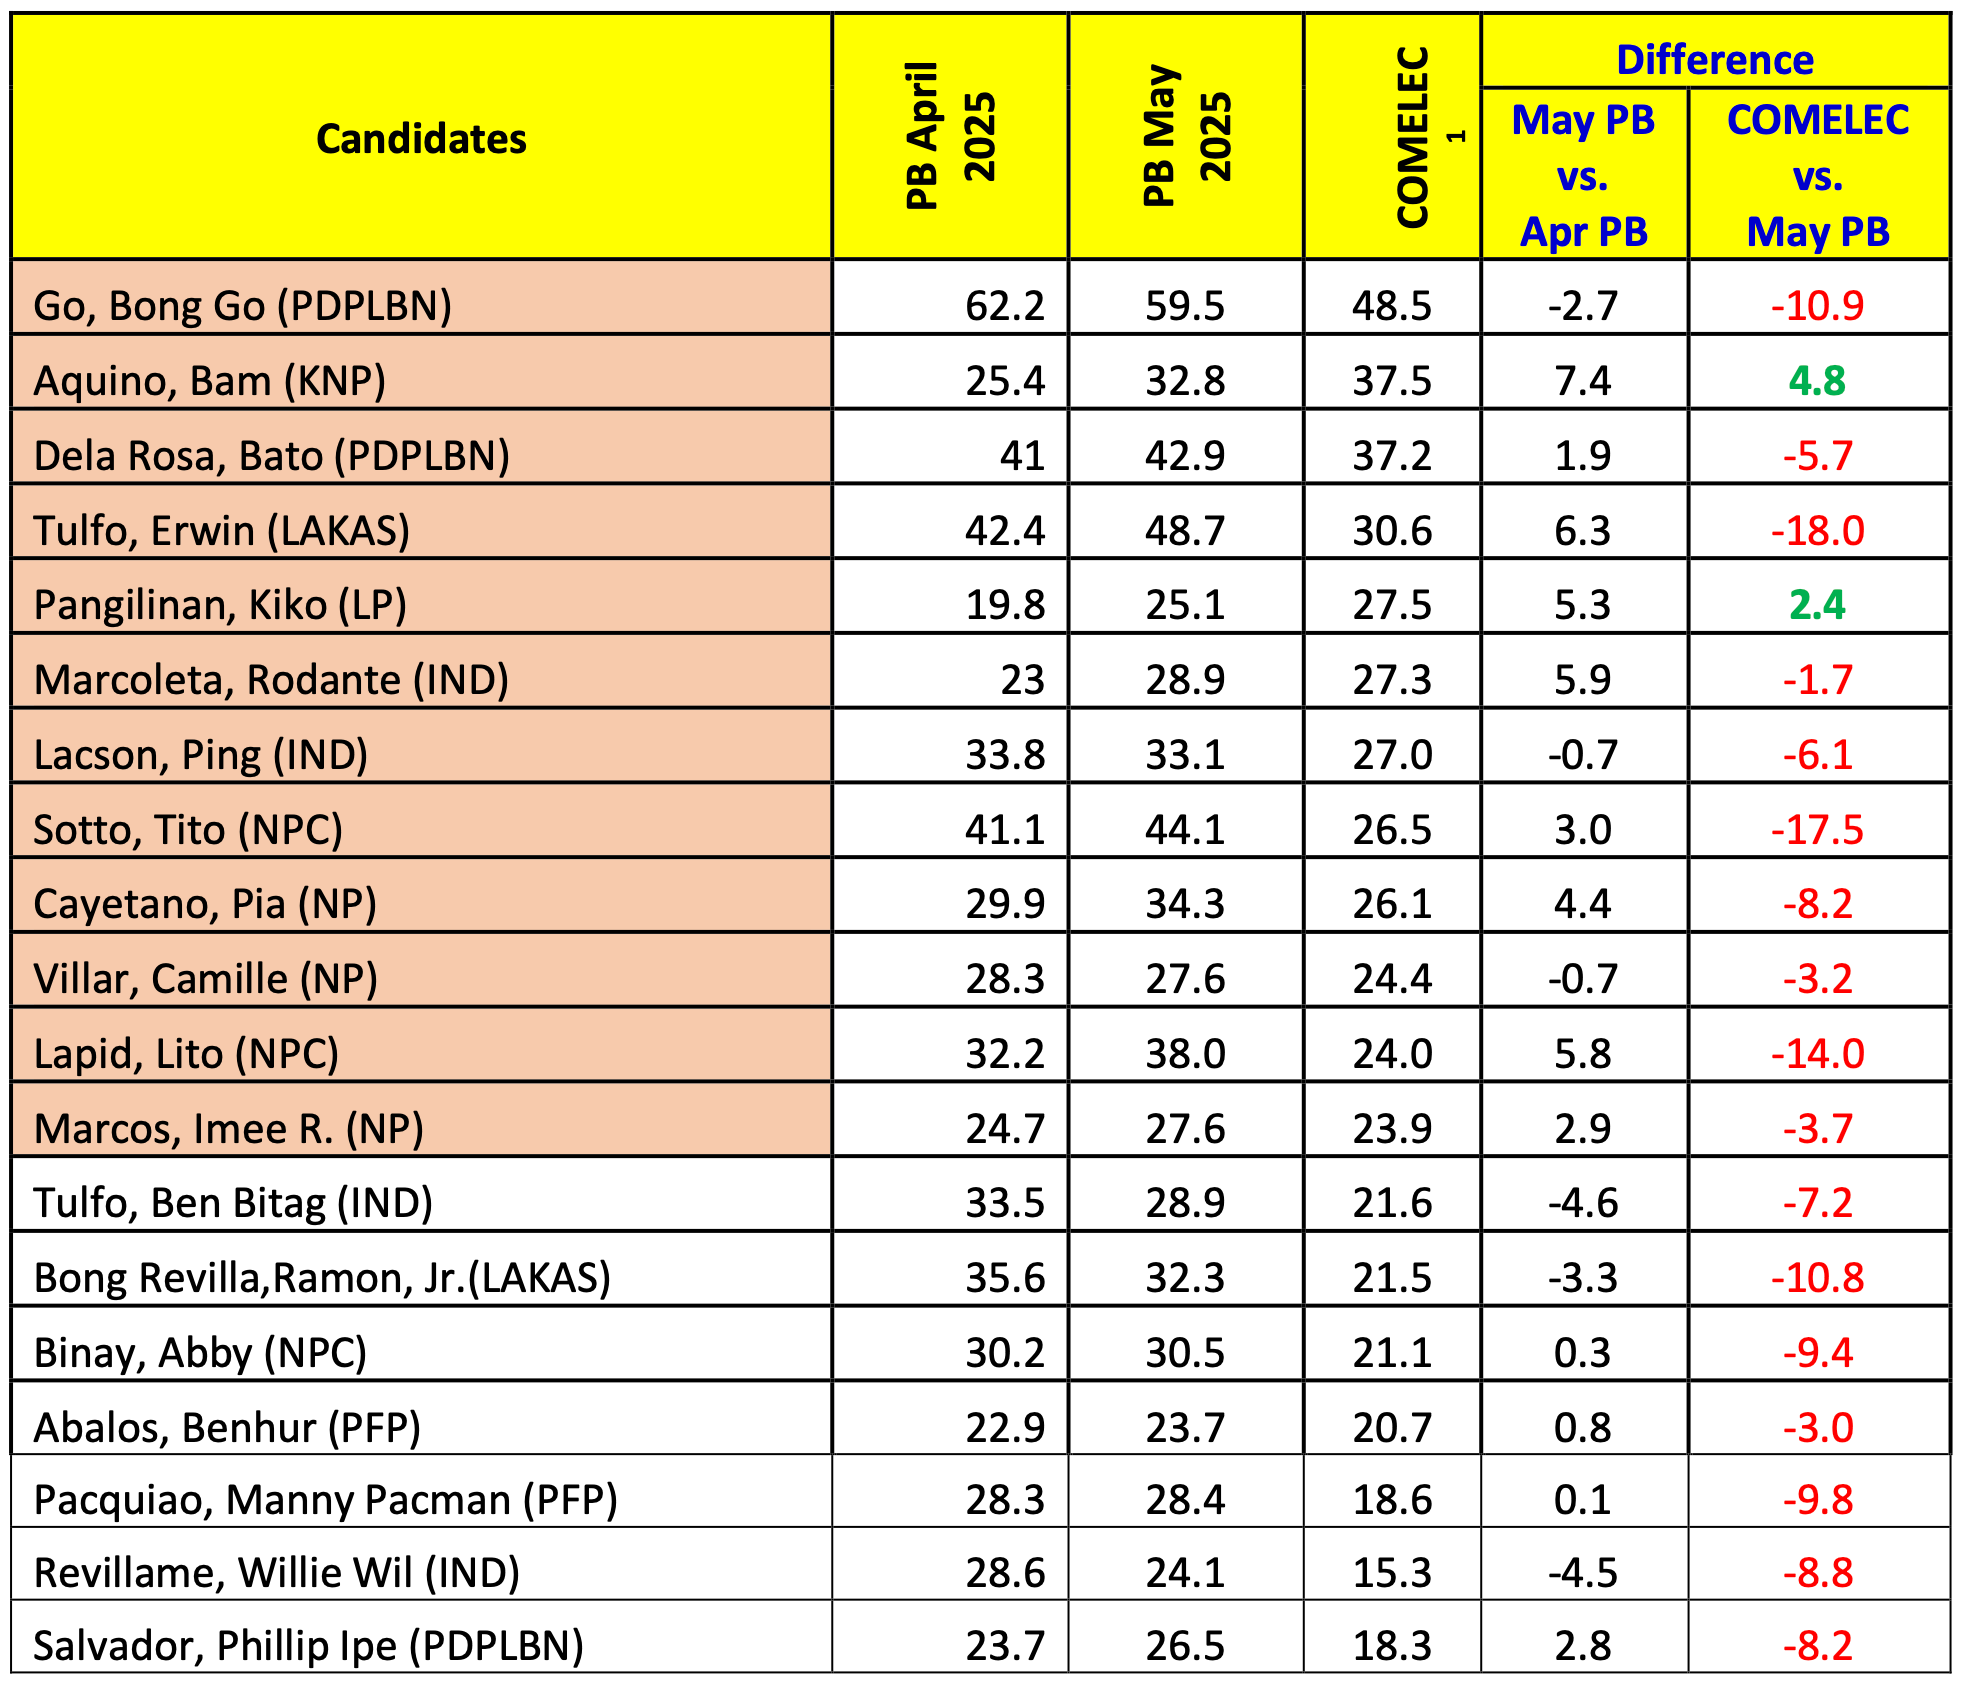
Looking at the circle of winners (again in green), the last column shows the difference in vote shares between the May survey and the final election results. The table shows that the difference between the May survey results and the final vote shares was statistically significant for six of the 12 final winners (Go, Tulfo, Lacson, Sotto, Cayetano, Lapid,). More precisely, in all these cases, the May survey results predicted vote shares that were higher than the final vote count to a statistically significant degree.
1 Total number of votes obtained from https://2025electionresults.comelec.gov.ph/coc-result
For the remaining six winners (Aquino, de la Rosa, Pangilinan, Marcoleta, Villar, and Marcos), the voting preferences in the May survey results and the actual vote shares were not statistically different. This second list notably includes candidates whose victories were “unexpected” at least to some sections of the public. From the perspective of the last survey in May, however, the election of these latter six should not have been a surprise.
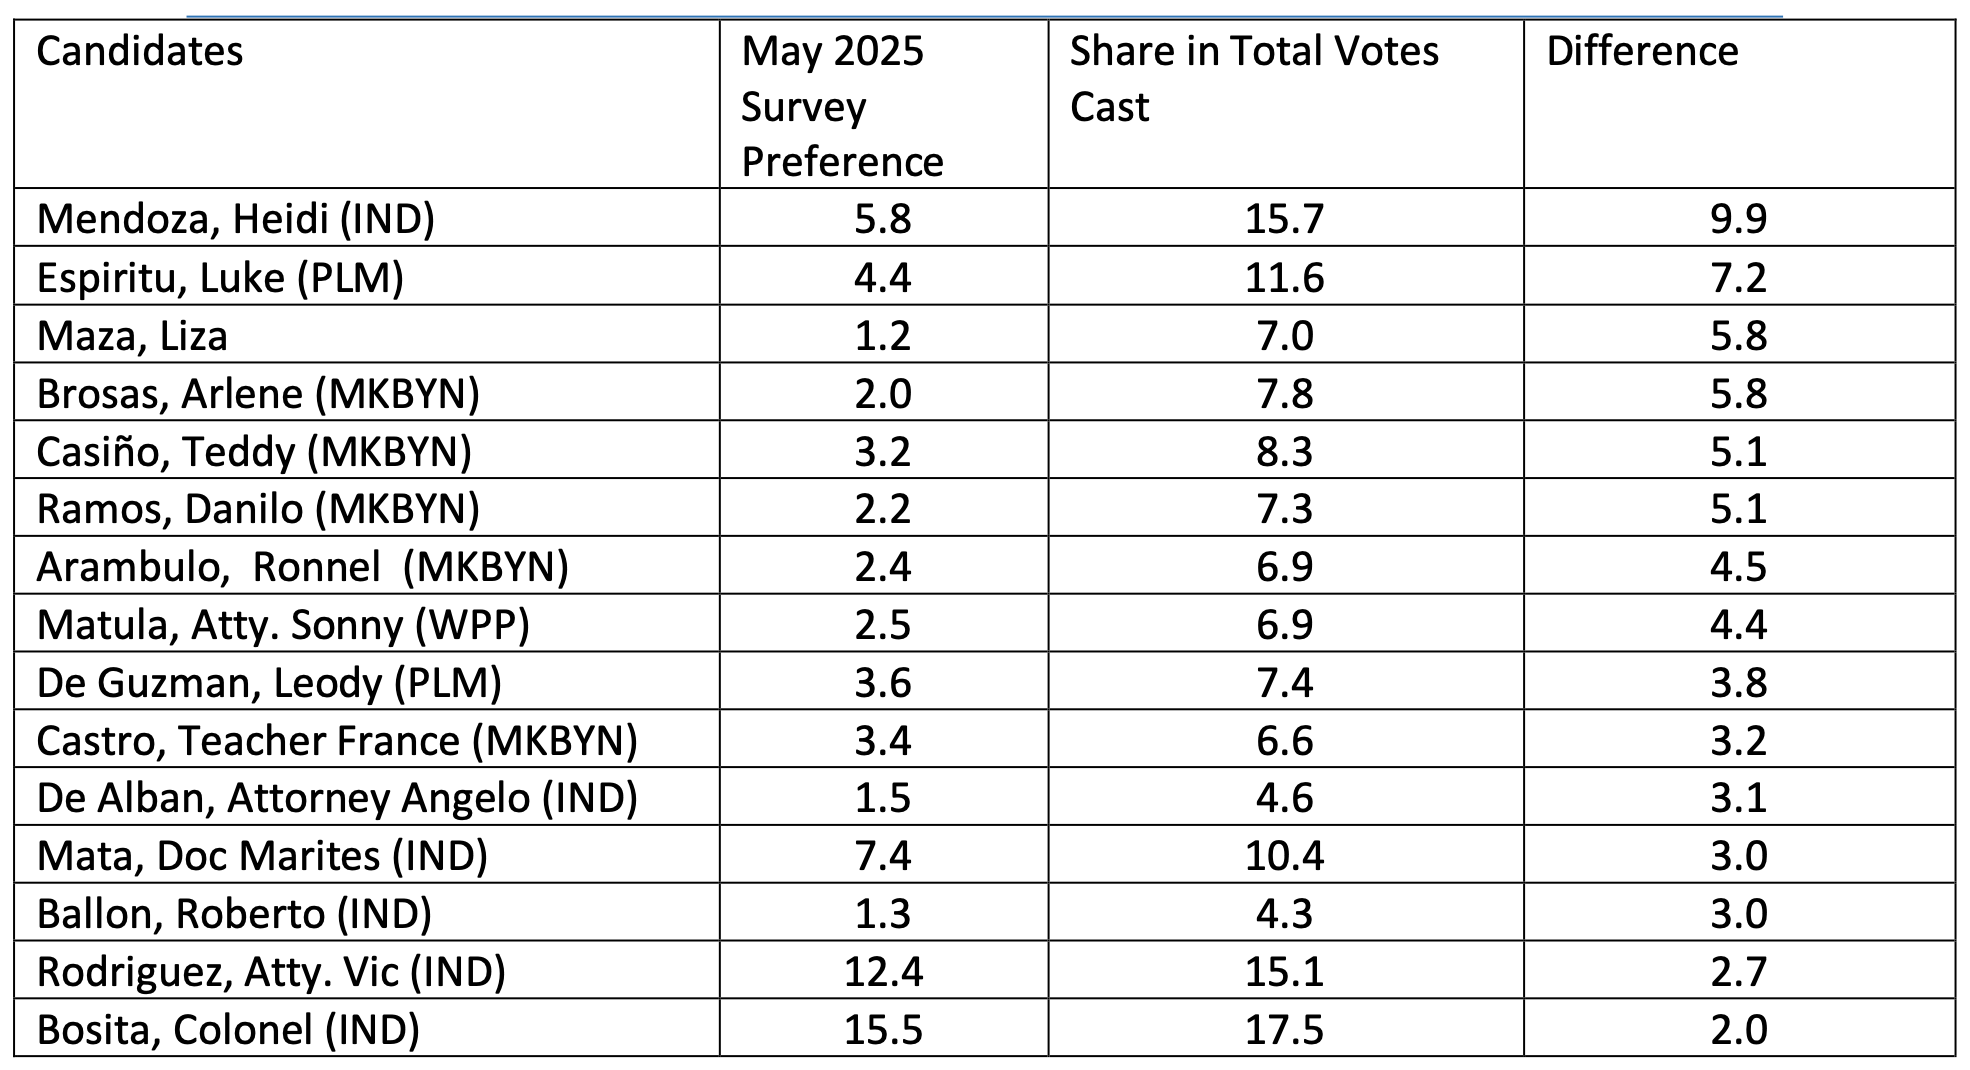
The consistently lower actual vote shares for nearly all 19 candidates, compared to the May survey predictions—with the exception of Aquino and Pangilinan, whose vote shares were slightly under-reported—raise at least two important questions. First, could this discrepancy be attributed to the large number of over-votes? According to the National Movement for Free Elections (NAMFREL), over 17 million over-votes for senatorial candidates were recorded on May 12.[1] This suggests a need to closely examine the millions of ballots containing senate overvotes. Second, did some voters shift their support to candidates not included among the 19 featured in the May 2025 survey? In relation to this, Table 4 shows that several candidates— mostly independents and those affiliated with progressive groups—received a higher share of total votes than their pre-election survey standings indicated.
[1] https://www.namfrel-analytics-apc.org/election-statistics. Accessed on May 25, 2025.
Table 4. Changes in vote shares of other senatorial candidates.
(Figures in %, ordered by the difference between May 2025 pre-elecon preferences and actual share of total votes cast)
A further possible factor is that votes were reallocated among the top candidates. In the matter of changing trajectories in voter preferences, the May results may be compared to an earlier April survey to see any possible changes in position as election day approached. Of the candidates in contention in the May 2025 survey, four experienced a statistically significant increase in voter preference compared to the earlier April 2025 survey. These were Bam Aquino (+7.4 percentage points), Erwin Tulfo (+6.3 points), Rodante Marcoleta (+5.9 points), and Lito Lapid (+5.8 points). (Although somewhat below statistical significance (5.3 points), Pangilinan’s vote share also showed a positive trajectory.)
When comparing the final election results to the May survey, however, only Bam Aquino (+4.8 percentage points) and Kiko Pangilinan (+2.4 points) sustained momentum. They registered a further increase in their final vote shares relative to the May survey. In contrast, Marcoleta’s, E Tulfo’s, and Lapid’s final shares were lower on election day.
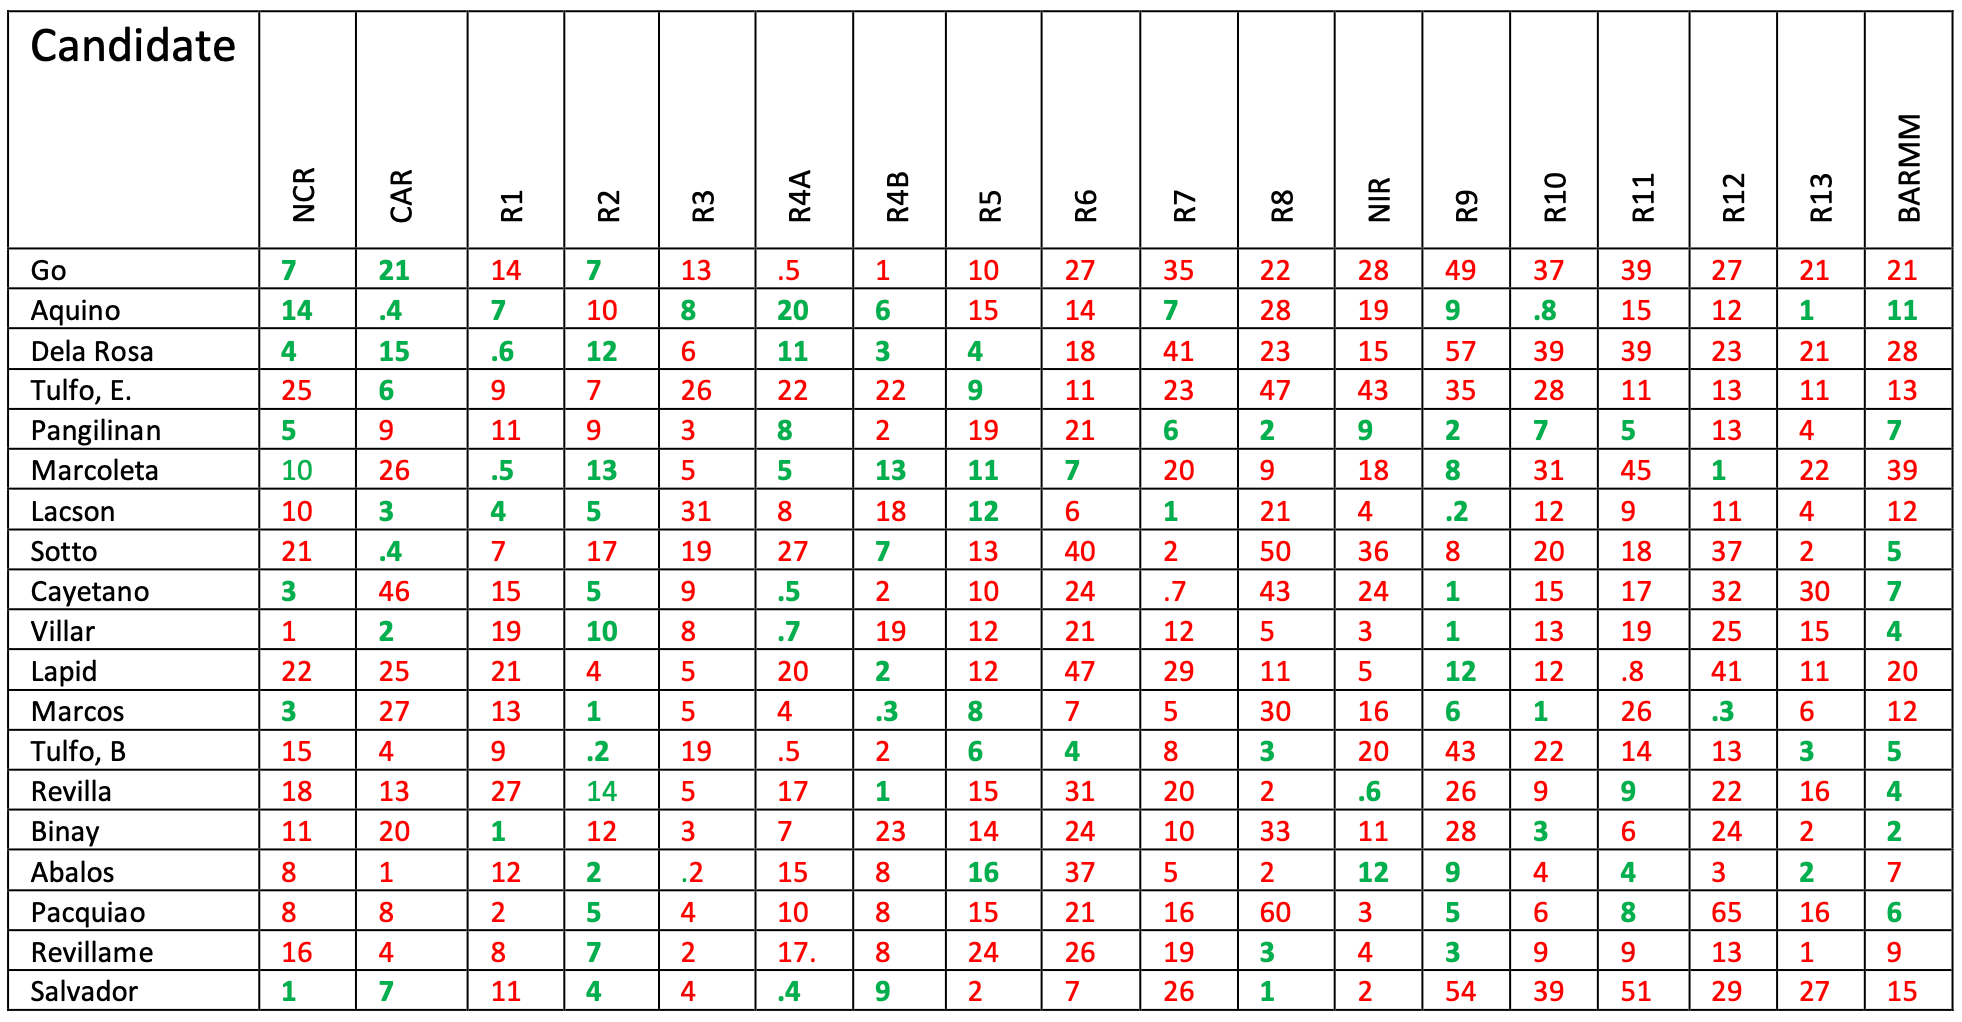
Table 5 illustrates regional shifts in vote shares for candidates competing for the 12 Senate seats, comparing figures from the May 2025 Pulso ng Bayan survey with the actual election results. The data reveals where individual candidates either gained or lost ground between the survey and the final vote count.
From these trends, it appears that the political machinery of both the Marcos administration and the Duterte opposition struggled to sustain or expand support for their respective candidates.
For the Marcos camp, notable drops in vote shares in Regions 1, 3, 4A, and 8 point to a failure to mobilize voter support—even in areas traditionally viewed as strongholds (such as Regions 1 and 8) or considered ripe for strategic consolidation. Similarly, the Duterte-aligned opposition failed to retain its previously dominant backing across Mindanao, leading to a diminished performance in a region once firmly in its corner.
Table 5. Variance between May 2025 survey pre-election preference and share of votes in each region
(Figures in percentage points, rounded off to full figure, Green for an increase,
Red for a decline)
A note on surveys
Surveys—particularly those that use probabilistic sampling—are widely recognized as a scientific method for measuring public opinion. When properly designed, they can produce results that accurately reflect the views of the broader population. Since 1999, Pulse Asia Research, Inc. has consistently employed the same sampling methodology, adjusting weighting factors over time to reflect demographic changes.
As with all methods of social research, surveys carry a certain degree of uncertainty, which is captured through the confidence level. Pulse Asia surveys are conducted with a 95% confidence level, meaning that if the same survey were conducted 100 times, the true population value would fall within the reported range in 95 of those instances. This range— known as the confidence interval—is determined by the margin of error, which is added to and subtracted from the survey results. For example, if 35% of voters support a candidate and the margin of error is ±3%, the actual level of support in the population is likely between 32% and 38%.
Surveys are often described as snapshots of public opinion at a specific moment. As such, it is natural to see shifts in opinions or pre-election preferences over time. This pattern has been consistently observed in our own surveys as well as in those conducted in many other countries.
When it comes to voting behavior, these shifts in pre-election preferences challenge the common criticism that surveys have a conditioning effect on voters. In reality, the changes reflect that citizens exercise their own agency. Voting decisions are shaped not by survey results, but by individuals' personal judgments about which candidates are most likely to pursue policies that align with their hopes and aspirations, as well as the political circumstances that obtained in the months, and even days, prior to the elections. In short, the more reasonable and straightforward assertion is that opinions determine survey results, not the other way around.
If you liked what you just read and want more of Our Brew, subscribe to get notified. Just enter your email below.
Related Posts
Numbers vs. Influence: My Take on the Philippine Evangelical Church Today
Feb 23, 2026
Who is Missing Which Strongman? Competing Authoritarian Nostalgias in the Philippines
Feb 04, 2026
The Sorrowful Mystery of Cabral’s Death
Dec 20, 2025