

by Social Weather Stations
Fourth Quarter 2021 Social Weather Survey: 57% adult Filipinos choose health over love and money, down from the 70% in 2019
- 84% prefer brains over body
- 4% are very happy with their love life; 18% say they have no love life
The Fourth Quarter 2021 Social Weather Survey, conducted from December 12-16, 2021, had three items discussing Valentine’s Day. In this context, to the question, “If you could have only one of the following, which would you pick: money, health, or love?” 57% chose health, 31% chose love, and 11% chose money [Chart 1].
Compared to December 2019, before the pandemic, preference for health fell by 13 points from 70%.
On the other hand, preference for love rose by 8 points from 23%, while preference for money rose by 4 points from 7%.
Two other questions about love were asked in the December 2021 survey [Charts 2 and 3].
84% prefer brains over body
The survey found 84% saying they are more attracted to a person’s brains than body, and 15% saying the opposite [Chart 2].
The percentage of those who prefer brains over body is 3 points above the 81% in December 2019 and December 2002.
54% are very happy with their love life; 18% say they have no love life
The December 2021 survey also found 53% saying their love life is very happy (napakasaya), 28% saying it could be happier (sana mas masaya pa), and 18% saying they do not have a love life (walang love life o buhay-pag-ibig) [Chart 3].
Compared to December 2019, those very happy with their love life hardly changed from 54%, while those saying their love life could be happier fell by 4 points from 32%, and those saying they have no love life rose by 4 points from 14%.
Since 2002, around half of adult Filipinos were recorded to have a very happy love life, ranging from the record-low 46% in 2004 to the record-high 59% in 2011.
On the other hand, those saying their love lives could be happier range from 29% to 44%, while those with no love life range from 9% to 18%.
When forced to choose, more women than men choose health over love and money
Overall, 60% of women prefer health over love and money, 6 points higher than the 54% among men with the same view [Chart 4].
Compared to December 2019, however, preference for health over love and money fell among both women and men.
It fell by 12 points from 72% among women and by 13 points from 67% among men.
On the other hand, preference for love over health and money rose by 9 points among women, from 20% to 29%, and by 7 points among men, from 26% to 34%.
At the same time, preference for money over health and love rose by 4 points among women, from 7% to 11%, and by 6 points among men, from 6% to 12%.
Preference for health over love and money is highest among women with live-in partners
The percentage of those who prefer health over love and money is highest among women with live-in partners (68%), followed by single women (63%) and married women (56%).
Among men, preference for health over love and money is highest among those who are single (58%), followed by those with a live-in partner (54%) and those who are married (52%).
Compared to December 2019, however, the percentage of those who prefer health over love and money declined among both sexes across civil status.
It fell by 20 points from 76% among married women, by 4 points from 72% among women with live-in partners, and by 2 points from 65% among single women.
It fell by 25 points from 79% among men with live-in partners, by 12 points from 70% among single men, and by 11 points from 63% among married men.
Among both men and women, preference for love over love and money has no clear pattern in terms of age [Chart 5].
Preference for health over love and money rises with education
Preference for health over love and money rises with education among both sexes.
Among women, the percentage of those who prefer health over love and money is highest among college graduates (64%), followed by junior high school graduates (62%), elementary graduates (59%), and non-elementary graduates (52%) [Chart 6].
The same pattern applies for men: those who prefer health over love and money are highest among college graduates (58%), followed by junior high school graduates (55%), elementary graduates (53%), and non-elementary graduates (48%).
Compared to December 2019, preference for health over love and money declined among both men and women in all educational levels.
Preference for brains over body is slightly higher among women than men
The percentage of those who prefer brains over body is slightly higher among women (88%) than among men at (81%) [Chart 7].
Compared to December 2019, preference for brains over body rose by 5 points from 83% among women and by 3 points from 78% among men.
Preference for brains over body is highest among single women
Among women, the percentage of those who prefer brains over body is highest among single women (90%), followed by women with live-in partners (89%), and married women (86%).
Compared to December 2019, preference for brains over body rose by 8 points from 82% among single women and by 5 points from 81% among married women. It stayed at 89% among women with live-in partners.
On the other hand, men’s preference for brains over body hardly varies by civil status, ranging from 80% to 82%.
Compared to December 2019, preference for brains over body rose by 4 points from 78% among single men, by 3 points from 77% among men with live-in partners, and by 2 points from 79% among married men.
Preference for brains over the body is highest among 18-24-year-old women, lowest among men 55 years old and above
Among women, those who prefer brains over body are highest among the 18-24-year-olds (91%), followed by the 24-34-year-olds (89%), the 35-44-year-olds (87%), the 45-54-year-olds (86%), and those 55 years old and above (86%) [Chart 8].
Among men, preference for brains over body is higher among those 18 to 54 years old, ranging from 82% to 87%, than among those 55 years old and above, at 73%
Compared to December 2019, preference for brains over body rose in all age groups except among the 45-55-year-old women and the 35-44-year-old men.
Preference for brains over body is higher among more educated women
Among women, preference for brains over body rises with education: it is highest among college graduates (92%), followed by junior high school graduates (88%), elementary graduates (86%), and non-elementary graduates (84%) [Chart 9].
Among men, preference for brains over body hardly varies with education, ranging from 77% to 83%.
Compared to December 2019, preference for brains over body rose in both sexes across educational levels, except among college graduate men where it fell by 6 points from 87% to 81%.
Happiness with love life is high among both men and women
The December 2021 survey found 56% of men saying they are very happy with their love life, statistically equal to the 51% among women [Chart 10].
Compared to December 2019, the percentage of men with a very happy love life fell by 4 points from 60% to 56%, while those who wish their love life could be happier stayed at 26%.
However, those who say they have no love life rose by 3 points from 14% to 17%.
Among women, those with a very happy love life rose by 2 points from 49% to 51%, while those who wish their love life could be happier fell by 8 points from 38% to 30%.
However, those who say they have no love life rose by 6 points from 13% to 19%
Happiness with love life is higher among those who are married, especially among men
In general, married men and married women have a happier love life than their single and with live-in partner counterparts.
The percentage of those with a very happy love life is highest among married men (68%), followed by men with a live-in partner (65%) and single men (26%).
Among women, those with a very happy love life are also highest among those who are married (62%), followed by those with a live-in partner (60%), and those who are single (27%).
Compared to December 2019, the percentage of those with a very happy love life fell by 4 points from 74% among married men, while it hardly changed from 64% among men with a live-in partner. It stayed at 26% among single men.
Among women, it rose by 4 points from 58% among those who are married and by 9 points from 51% among those with a live-in partner. It hardly changed from 26% among those who are single.
On the other hand, the percentage of those wishing their love life could be happier stayed at 28% among married men, while it hardly changed from 17% among single men. It fell by 3 points from 36% among men with a live-in partner.
Among women, it fell by 5 points from 40% among those who are married, by 10 points from 48% among those with a live-in partner, and by 8 points among those who are single.
However, the percentage of those saying they have no love life rose by 2 points among married men and by 2 points among men with a live-in partner. It hardly changed from 57% among single men.
It also rose by 2 points from 1% to 3% among married women, and by 6 points from 50% to 56% among single women. It stayed at 2% among women with a live-in partner.
Happiness with love life is higher among older men
The percentage of those with a very happy love life is higher among men 35 years old and above, ranging from 59% to 60%, than among men 18 to 34 years old, ranging from 40% to 52% [Chart 11].
Among women, those with a very happy love life is higher among those 25 to 54 years old, ranging from 51% to 65%, than among the 18-24-year-olds (47%) and those 55 years old and above (41%).
Happiness with love life has no clear pattern by educational level [Chart 12].
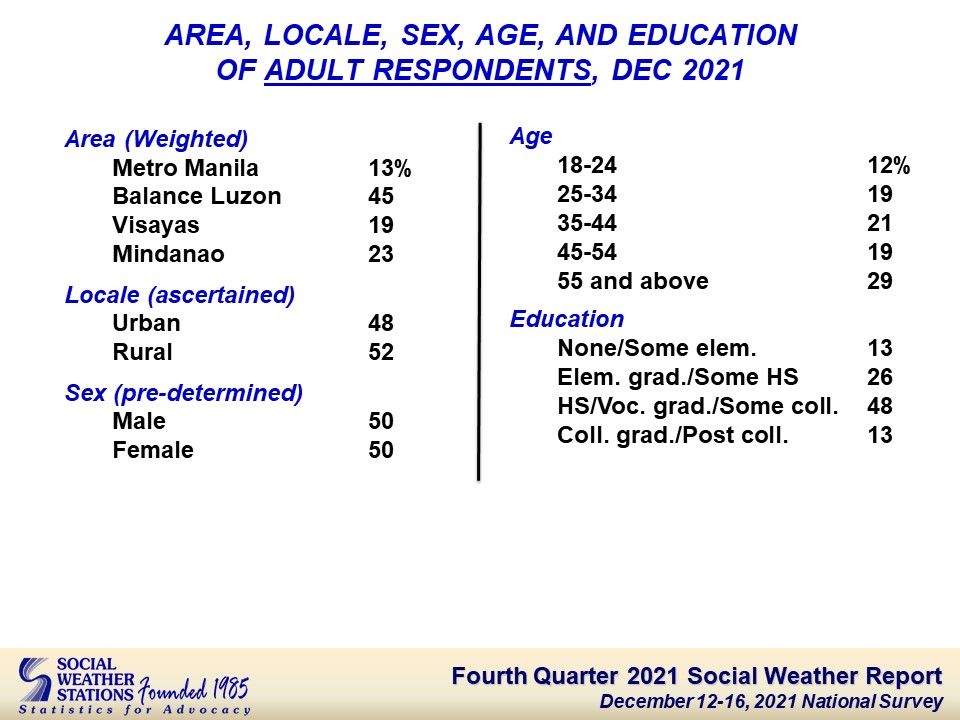
Socio-demographic characteristics of respondents
Applying census weights, 13% of the respondents are from Metro Manila, 45% from Balance Luzon (or Luzon outside Metro Manila), 19% from the Visayas and 23% from Mindanao [Table 1].
Forty-eight percent are from urban areas, and the balance of 52% are from rural areas.
Male and female respondents have a 1 to 1 ratio, and thus, are alternately sampled.
By age group, 12% are youth (18-24), 19% are intermediate youth (25-34), 21% are middle-aged (35-44), 19% are 45 to 54 years old, and 29% are 55 years old and above.
By education, 13% had at most some elementary education, 26% either finished elementary or had some high school education, 48% either finished high school, completed vocational school, or attended some college, and 13% either graduated from college or took post-graduate studies.
Survey background
The Fourth Quarter 2021 Social Weather Survey was conducted from December 12-16, 2021, using face-to-face interviews of 1,440 adults (18 years old and above) nationwide: 360 each in Balance Luzon, Metro Manila, the Visayas, and Mindanao. Face-to-face is the standard interviewing method for Social Weather Stations; the only exceptions were early in the pandemic when movement restrictions made face-to-face impossible and mobile phone interviews were conducted. Normal face-to-face field operations resumed in November 2020. The sampling error margins are ±2.6% for national percentages and ±5.2% for Balance Luzon, Metro Manila, the Visayas, and Mindanao.
The area estimates were weighted by the Philippine Statistics Authority medium-population projections for 2021 to obtain the national estimates.
The survey items reported here were non-commissioned. They were done on SWS’s own initiative and released as a public service.
The exact phrasing of the survey questions (the source language is Filipino; English translation included) was:
“Q184. Pag-usapan naman po natin ang tungkol sa Valentine’s Day. Kung tutuusin, mas naaakit po ba kayo sa katawan o sa utak ng isang tao? (KATAWAN; UTAK) [Let us now talk about this coming Valentine’s Day. Trying to be as honest as you can, are you more attracted to people by their bodies or their brains? (BODIES; BRAINS)]
“Q185. Kung maaari po kayong magkaroon ng isa lang sa mga sumusunod, alin po ang inyong pipiliin: PERA, KALUSUGAN, o PAGMAMAHAL? (ONE ANSWER ONLY) [If you could have only one of the following, which would you pick: MONEY, HEALTH, or LOVE? (ONE ANSWER ONLY)]
“Q186. Alin po sa mga ito ang naglalarawan sa inyong “love life” o buhay- pag-ibig? (NAPAKASAYA, SANA MAS MASAYA PA, WALANG “LOVE LIFE” o BUHAY-PAG-IBIG) [Which phrase describes your love life? (VERY HAPPY, COULD BE HAPPIER, NO LOVE LIFE)]”
SWS employs its own staff for questionnaire design, sampling, fieldwork, data processing, and analysis and does not outsource any of its survey operations. This special report was prepared by Leo S. Laroza.
Chart 1
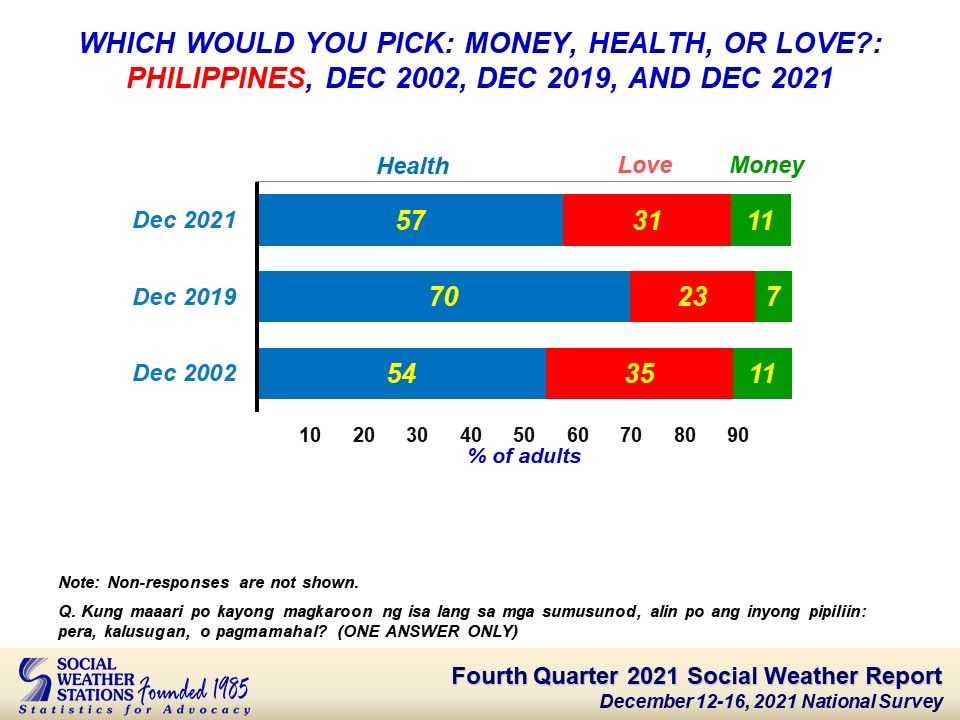
Chart 2
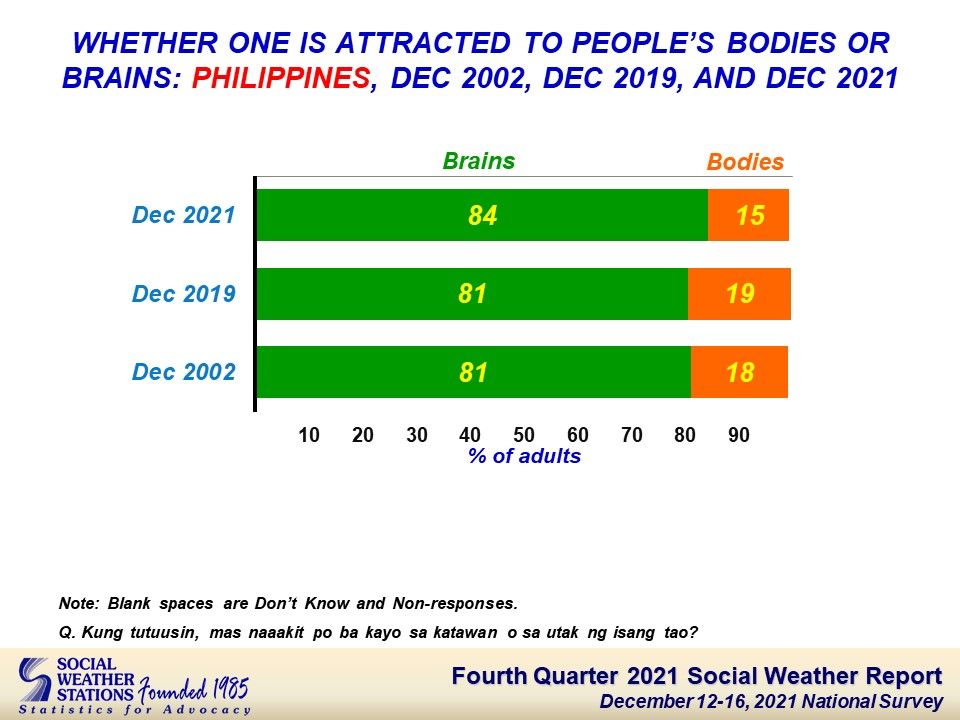
Chart 3
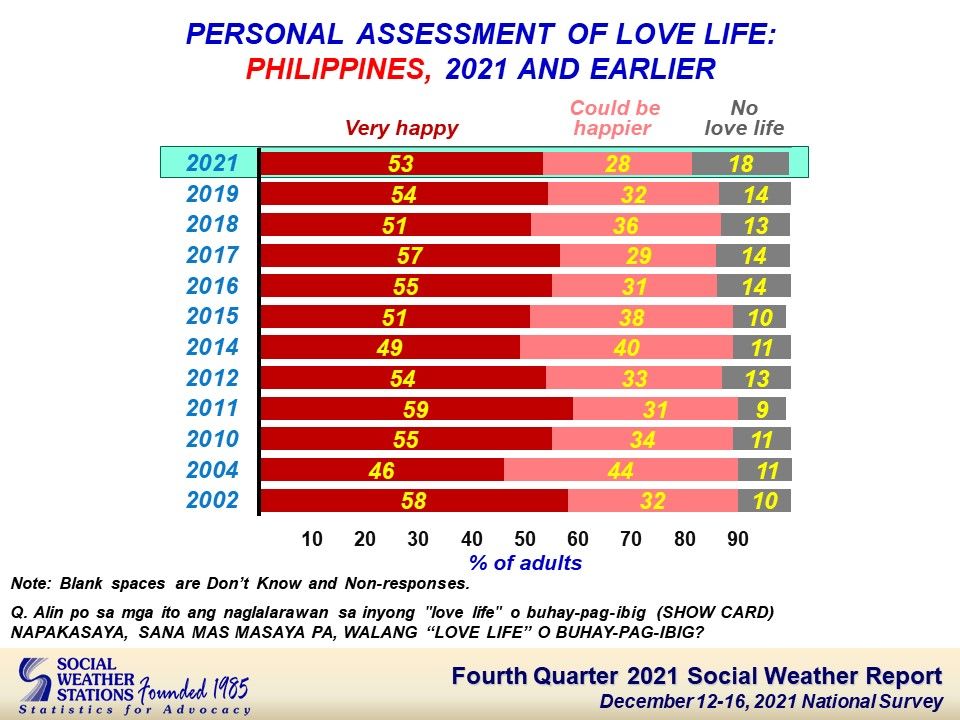
Chart 4
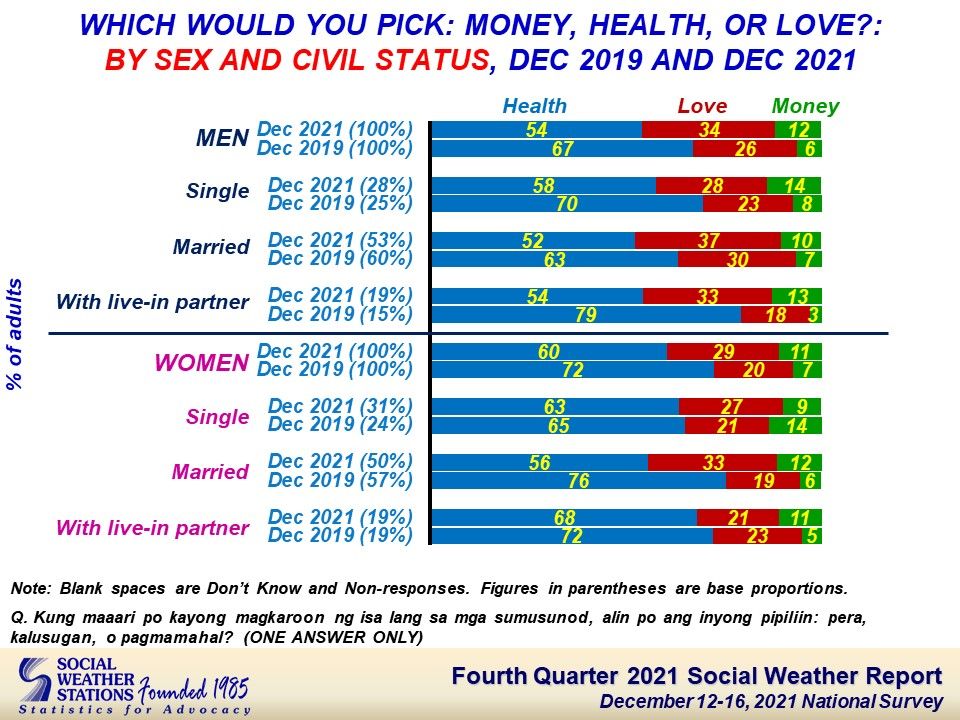
Chart 5
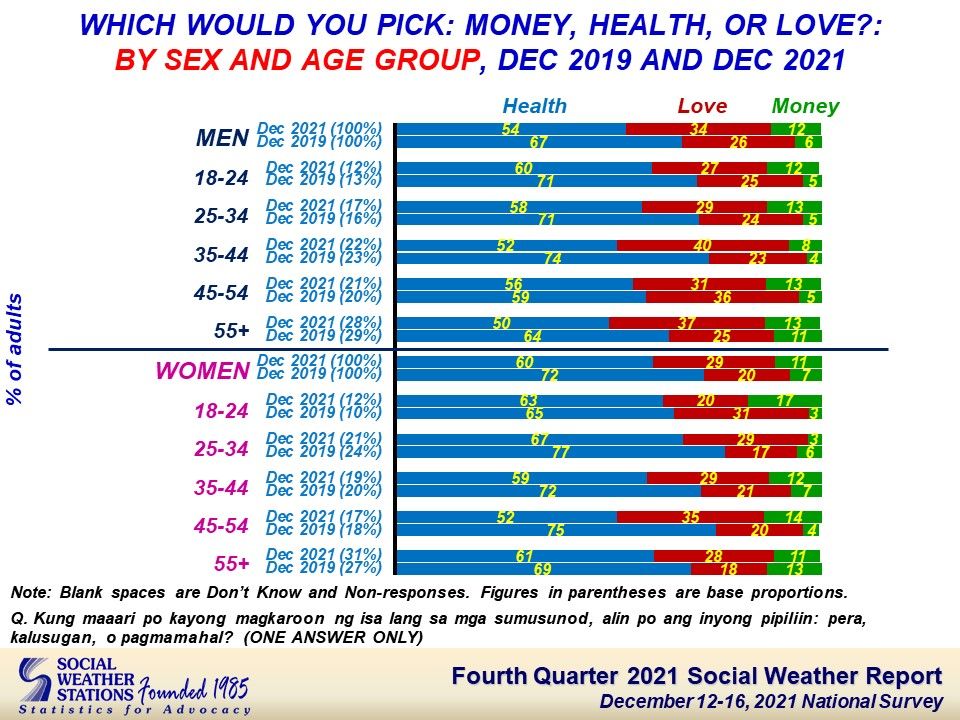
Chart 6
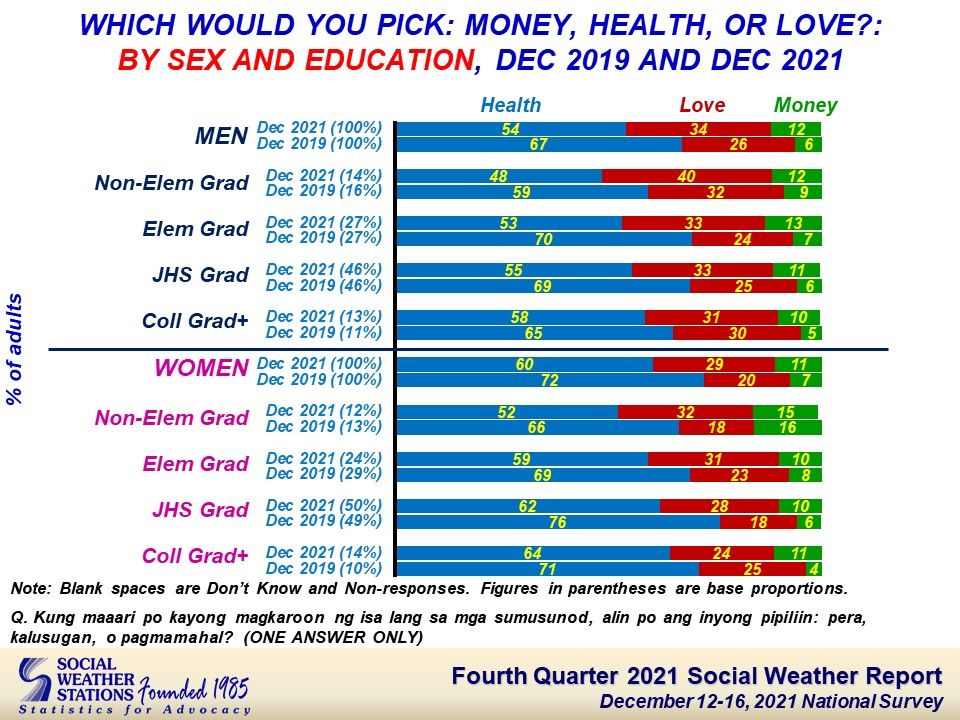
Chart 7
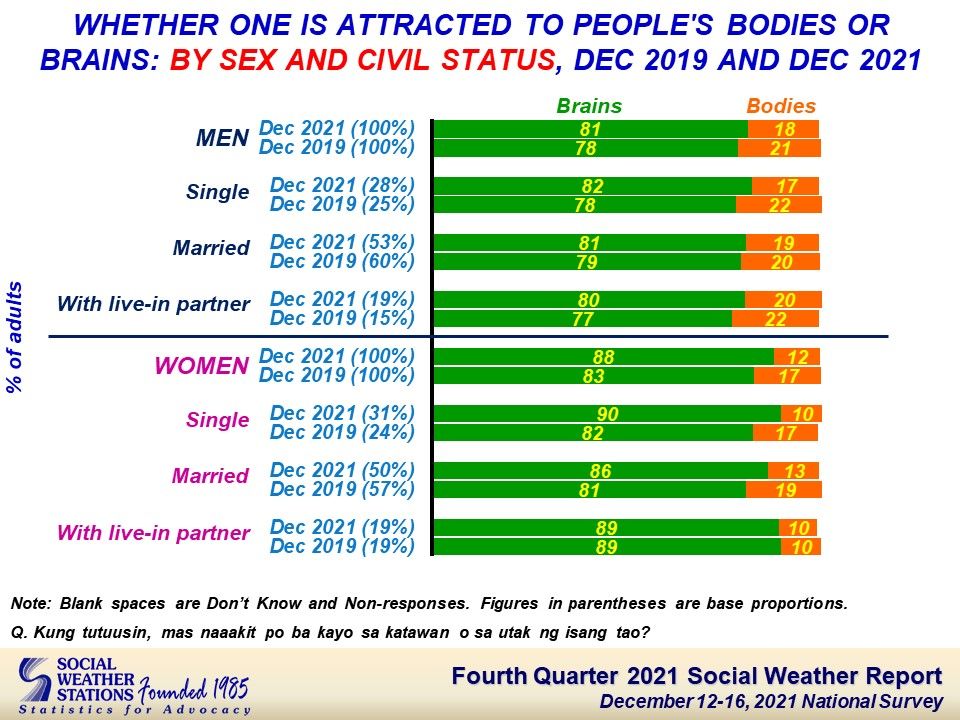
Chart 8
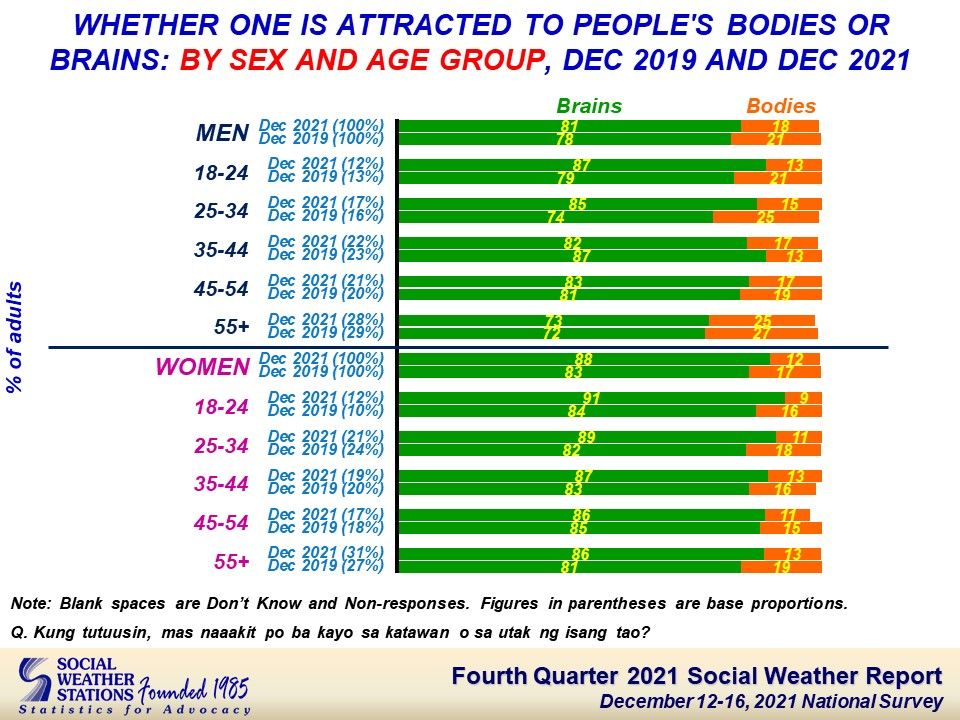
Chart 9
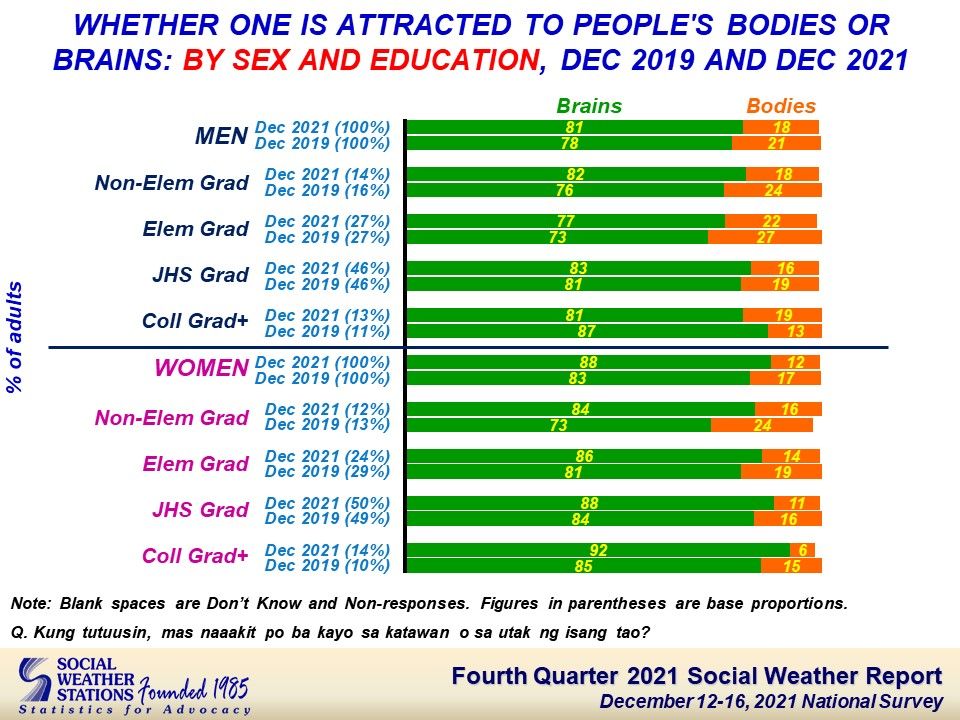
Chart 10
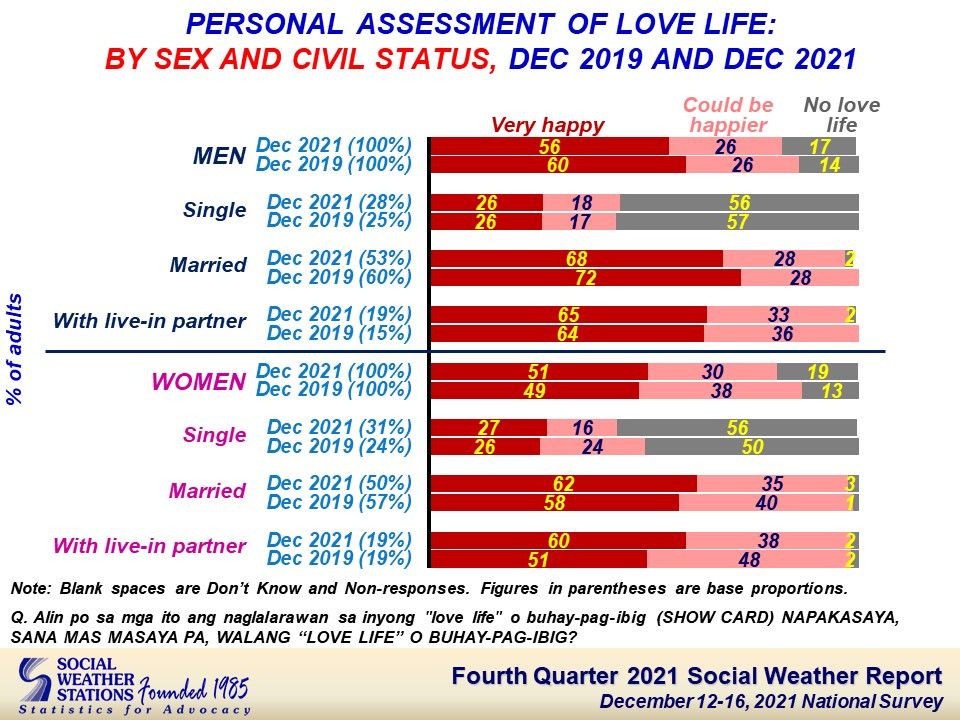
Chart 11
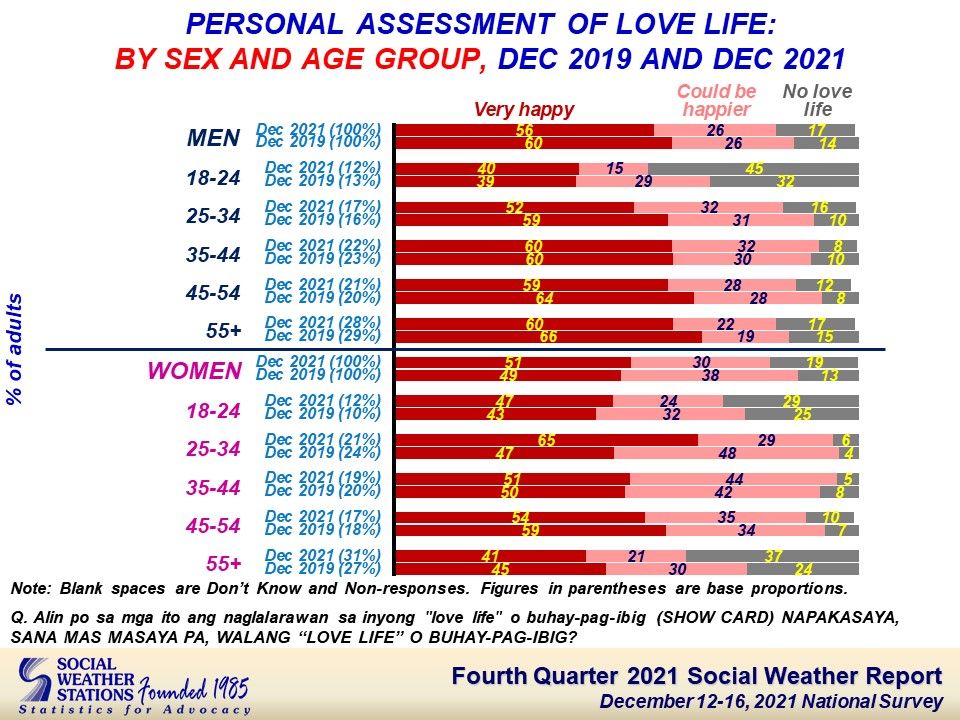
Chart 12
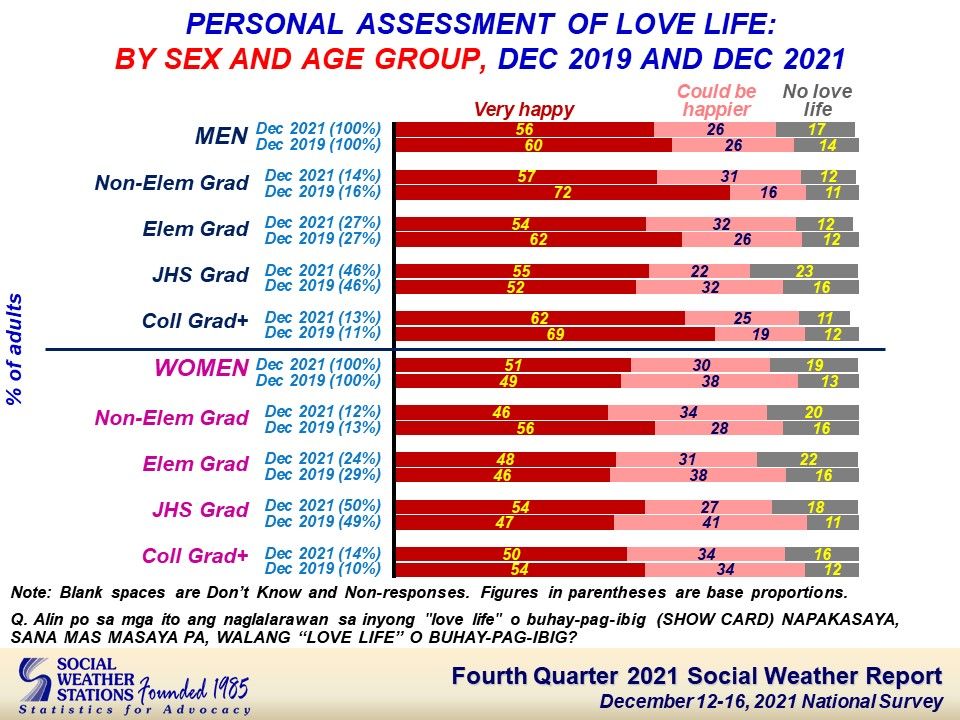
Table 1
If you liked what you just read and want more of Our Brew, subscribe to get notified. Just enter your email below.
Related Posts
Net satisfaction with the Marcos Administration fell to -13 in March 2026 from +14 in November 2025 - SWS
Jun 22, 2026
Massacre of Trees Under a Climate Crisis is Not Development — Greenpeace and NAPC-VDC
Jun 01, 2026
A Mass Killing in the Philippines Sparks Rare Scrutiny Over Counterinsurgency Violence – But No Wider Reckoning
May 31, 2026