
by Social Weather Stations
- Hunger falls in Mindanao and Balance Luzon
- Moderate Hunger 12.8%, Severe Hunger 3.3%
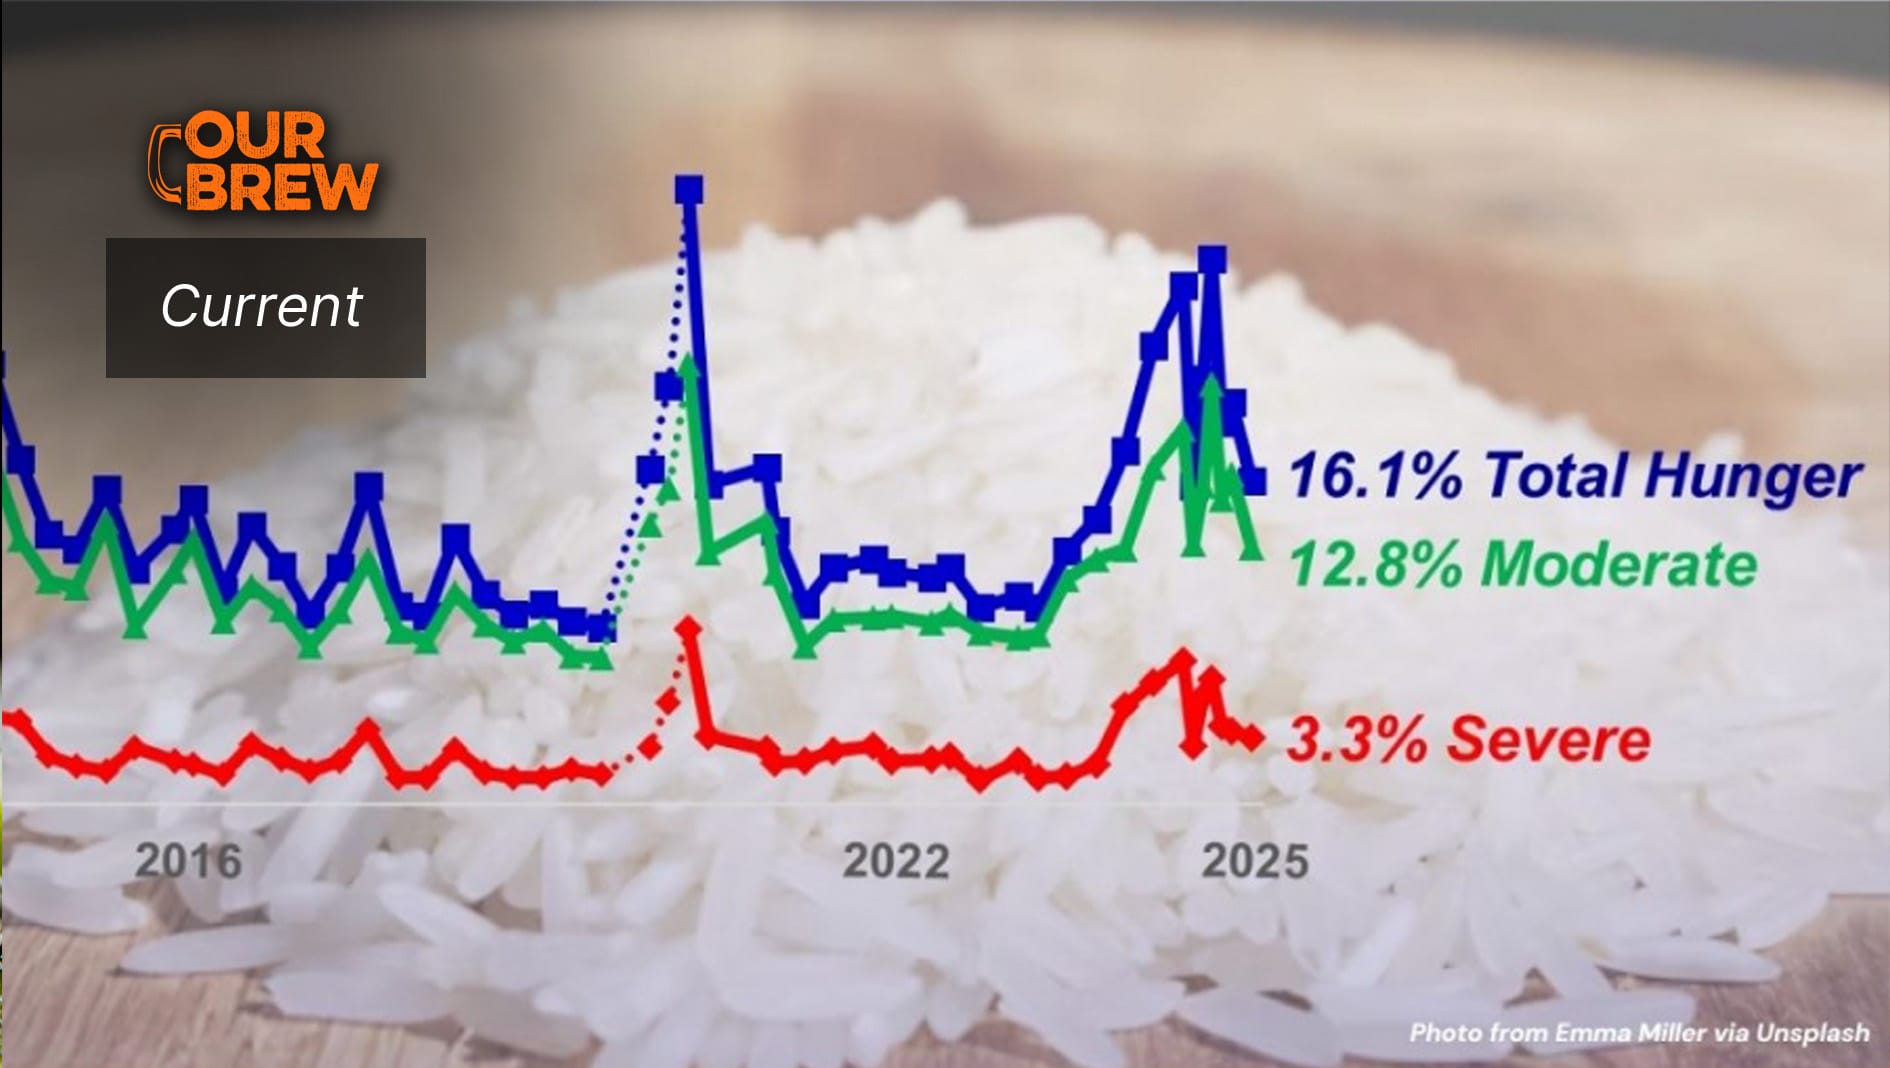
The national Social Weather Survey conducted from June 25-29, 2025, found that 16.1% of Filipino families experienced involuntary hunger – being hungry and having nothing to eat – at least once in the past three months.
This is 3.9 points below 20.0% in the April 23-28, 2025 survey. It was at 27.2% in March 2025, before falling to 19.1% in April 11-15, 2025 [Chart 1, Table 1].
The 2025 average of 19.9% was 0.3 points lower than the 2024 average of 20.2%, and 1.2 points lower than the record-high 21.1% average of 2020 during the COVID-19 pandemic [Chart 2].
Hunger falls in Mindanao and Balance Luzon
As of June 2025, the experience of hunger was highest in Metro Manila and the Visayas, both at 21.7% of families, followed by Balance Luzon (or Luzon outside Metro Manila) at 15.3%, and Mindanao at 9.7% [Chart 3, Table 2].
The 3.9-point decline in hunger between April 23-28, 2025 and June 25-29, 2025 was due to a sharp decrease in Mindanao and a slight decrease in Balance Luzon, combined with slight increases in the Visayas and Metro Manila.
Compared to April 23-28, 2025, the incidence of hunger fell sharply by 16.6 points from 26.3% in Mindanao, and 1.7 points from 17.0% in Balance Luzon. However, it rose by 2.0 points from 19.7% in the Visayas and 1.4 points from 20.3% in Metro Manila.
Moderate Hunger 12.8%, Severe Hunger 3.3%
The 16.1% hunger rate in June 25-29, 2025 was the sum of 12.8% who experienced Moderate Hunger and 3.3% who experienced Severe Hunger.
Moderate Hunger refers to those who experienced hunger “Only Once” or “A Few Times” in the last three months. Meanwhile, Severe Hunger refers to those who experienced it “Often” or “Always” in the previous three months.
Compared to April 23-28, 2025, Moderate Hunger fell by 3.6 points from 16.4%, while Severe Hunger hardly moved from 3.6%.
In Metro Manila, Moderate Hunger rose by 1.7 points from 14.3% in April 23-28, 2025 to 16.0% in June 25-29, 2025, while Severe Hunger hardly moved from 6.0% to 5.7% [Chart 4, Table 3].
In Balance Luzon, Moderate Hunger hardly changed from 13.9% to 13.0%, while Severe Hunger hardly moved from 3.1% to 2.3% [Chart 5, Table 4].
In the Visayas, Moderate Hunger fell by 1.3 points from 18.3% to 17.0%. However, Severe Hunger rose by 3.4 points from 1.3% to 4.7% [Chart 6, Table 5].
In Mindanao, Moderate Hunger fell sharply by 14.3 points from 21.3% to 7.0%, while Severe Hunger fell by 2.3 points from 5.0% to 2.7% [Chart 7, Table 6].
Hunger falls among both the Poor and Non-Poor
The June 2025 survey found 49% of Filipino families rating themselves as Mahirap or Poor, 10% rating themselves as Borderline (by placing themselves on a line dividing Poor and Not Poor), and 41% rating themselves as Hindi Mahirap or Not Poor (“SOCIAL WEATHER REPORT | Self-Rated Poverty (SRP) at 49% on June 25-29, 2025; Borderline at 10%, Not Poor at 41%,” August 1, 2025, www.sws.org.ph).
On Self-Rated Food Poverty, based on the type of food eaten by their families, the June 2025 survey also found 41% of families rating themselves as Food-Poor, 10% rating themselves as Food Borderline (by placing themselves on the line dividing Food-Poor and Not Food-Poor), and 49% rating themselves as Not Food-Poor.
Hunger occurs at different rates among the Poor and the Non-Poor. At any single point in time, hunger is usually higher among the Poor. From quarter to quarter, however, the hunger rates among the poor and the non-poor may change, either upward or downward. Hunger is highest among the food-poor [Charts 8 and 9].
The rate of Total Hunger (i.e., Moderate plus Severe) fell among the Self-Rated Poor from 25.9% in April 23-28, 2025 to 21.0% in June 25-29, 2025. Among the Non-Poor (Not Poor plus Borderline Poor), Total Hunger also fell from 14.1% to 11.4%.
Compared to April 23-28, 2025, the rate of Total Hunger fell among the Self-Rated Food-Poor from 28.4% to 21.3%, and among the Non-Food-Poor (Not Food-Poor plus Borderline Food-Poor) from 14.1% to 12.4%.
Survey background
The Second Quarter 2025 Social Weather Survey was conducted from June 25-29, 2025, using face-to-face interviews of 1,200 adults (18 years old and above) nationwide: 300 each in Metro Manila, Balance Luzon (or Luzon outside Metro Manila), the Visayas, and Mindanao. The sampling error margins are ±3% for national percentages and ±6% each for Metro Manila, Balance Luzon, the Visayas, and Mindanao.
The area estimates were weighted by the Philippine Statistics Authority medium-population projections for 2025 to obtain the national estimates.
The family’s experience of Hunger has been measured 154 times since July 1998. The SWS survey questions on Hunger were directed to household heads from July 1998 to December 2024, to registered voters from January 2025 to April 11-15, 2025, and to adult respondents in April 23-28, 2025 and June 25-29, 2025. These items are non-commissioned and are included on SWS’s initiative and released as a public service.
The exact phrasing of the survey questions (the source language is Filipino; English translation included) was:
On Hunger: “Nitong nakaraang tatlong buwan, nangyari po ba kahit minsan na ang inyong pamilya ay nakaranas ng gutom at wala kayong makain? (OO, HINDI) [In the last three months, did it happen even once that your family experienced hunger and not have anything to eat? (YES, NO)].
“IF EXPERIENCED HUNGER: Nangyari po ba ‘yan ng MINSAN LAMANG, MGA ILANG BESES, MADALAS, o PALAGI? [Did it happen ONLY ONCE, A FEW TIMES, OFTEN, or ALWAYS?]”
Moderate Hunger refers to those who experienced hunger “Only Once” or “A Few Times” in the last three months, while Severe Hunger refers to those who experienced it “Often” or “Always” in the last three months.
On Self-Rated Poverty and Self-Rated Food Poverty: “Saan po ninyo ilalagay ang inyong pamilya sa kard na ito?/ Tungkol naman sa klase ng pagkain ng pamilya ninyo, saan po ninyo ilalagay ang inyong pamilya sa kard na ito? [Where would you place your family in this card? / Based on the type of food eaten by your family, where would you place your family on this card?]”
Figure 1. Self-Rated Poverty Showcard

Half of the respondents are shown a card with the choices HINDI MAHIRAP (Not poor) and MAHIRAP (Poor), separated by a line (recorded as ‘Borderline), while the other half are shown a card containing the reverse order (negative showcard), to lessen response bias.
To arrive at the estimated numbers of Self-Rated Poor families, the percentage of respondent households rating themselves as poor was applied to the Philippine Statistics Authority medium-population projections for 2025.
SWS employs its own staff for questionnaire design, sampling, fieldwork, data processing, analysis, and archiving, and does not outsource any of its survey operations. This report was prepared by Leo S. Laroza.
Chart 1.a

Chart 1.b

Chart 2

Chart 3.b

Chart 3.b

Chart 4

Chart 5

Chart 6

Chart 7

Chart 8

Chart 9

Table 1


Table 2


Table 3


Table 4


Table 5


Table 6


If you liked what you just read and want more of Our Brew, subscribe to get notified. Just enter your email below.
Related Posts
The ICC Case against Rodrigo Duterte: Questions and Answers
Feb 18, 2026
‘Record-low’ 46% of Filipino Adults ‘Very Happy’ With Love Life - SWS
Feb 13, 2026
VP Sara Duterte’s Net Satisfaction Rating Rises in Latest SWS Survey
Feb 12, 2026