by Social Weather Stations
- Moderate Hunger 9.1%, Severe Hunger 2.2%
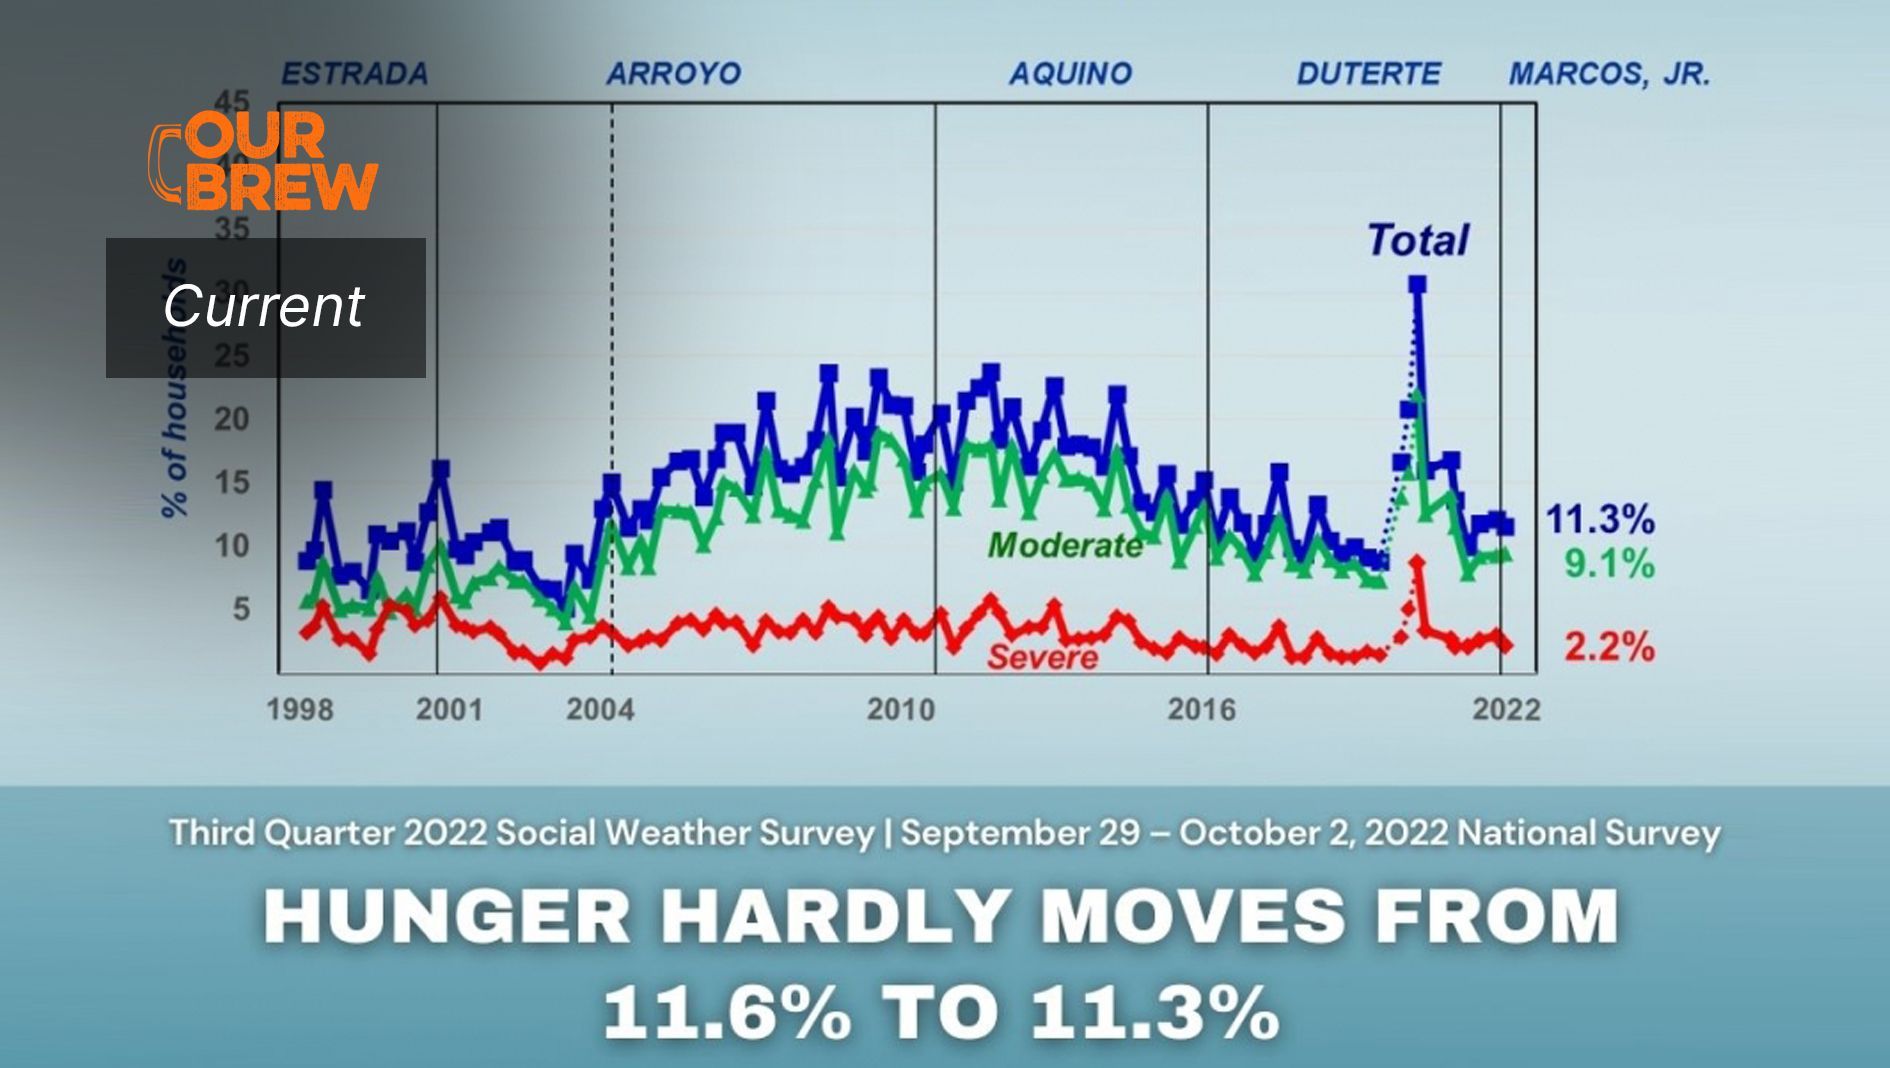
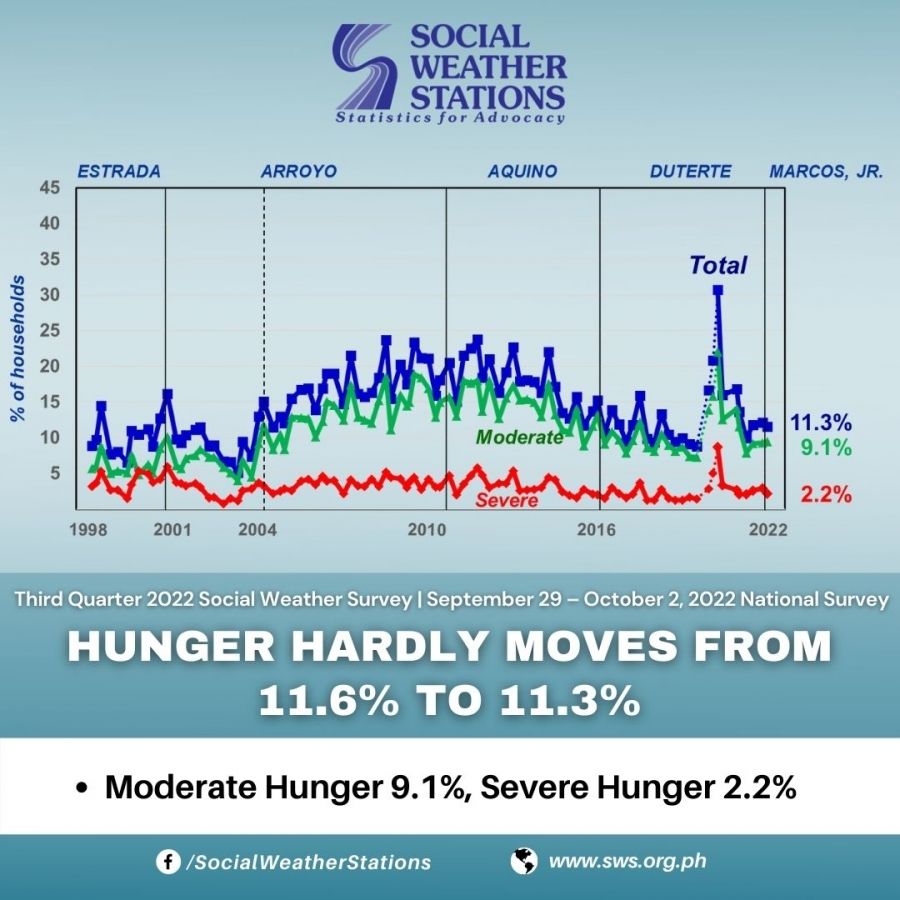
The national Social Weather Survey of September 29 – October 2, 2022, the first under the administration of President Ferdinand “Bongbong” Marcos, Jr., found that 11.3% of Filipino families, or an estimated 2.9 million, experienced involuntary hunger – being hungry and not having anything to eat – at least once in the past three months.
The October 2022 Hunger rate is similar to 11.6% (estimated 2.9 million families) in June 2022, but slightly below the 12.2% (estimated 3.1 million families) in April 2022 and 11.8% (estimated 3.0 million families) in December 2021.
However, it is still 1.3 points above the 10% (estimated 2.5 million families) in September 2021, and 2.0 points above the pre-pandemic annual average of 9.3% in 2019 [Charts 1 and 2, Table 1].
Hunger falls in Balance Luzon, but rises in Metro Manila, the Visayas, and Mindanao
The experience of hunger is highest in Metro Manila at 16.3% of families, followed by Mindanao at 15.3%, Balance Luzon (or Luzon outside Metro Manila) at 9.6%, and the Visayas at 7.0%. It has been highest in Metro Manila in 25 out of 99 surveys since July 1998 [Chart3, Table 2].
The 0.3-point decline in Overall Hunger between June 2022 and October 2022 is due to a decline in Balance Luzon, combined with increases in Metro Manila, the Visayas, and Mindanao.
Compared to June 2022, the incidence of Hunger fell by 2.3 points in Balance Luzon, from 11.9% (est. 1.4 million families) in June 2022 to 9.6% (est. 1.1 million families) in October 2022.
However, it rose by 1.6 points in Metro Manila, from 14.7% (est. 501,000 families) in June 2022 to 16.3% (est. 558,000 families) in October 2022.
It rose by 1.3 points in the Visayas, from 5.7% (est. 272,000 families) in June 2022 to 7.0% (est. 336,000 families) in October 2022.
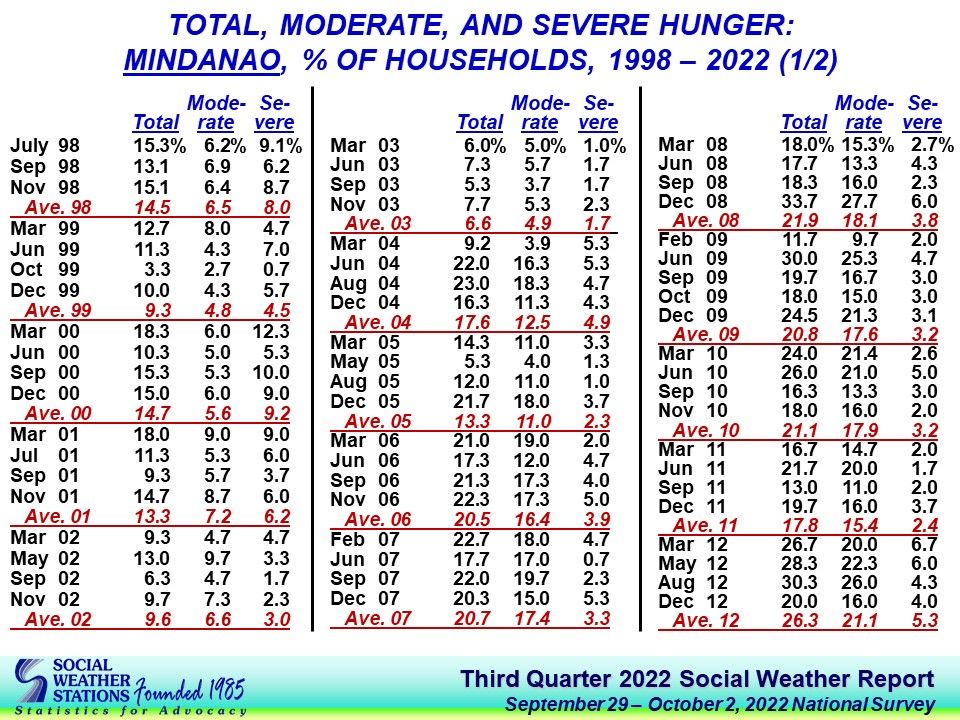
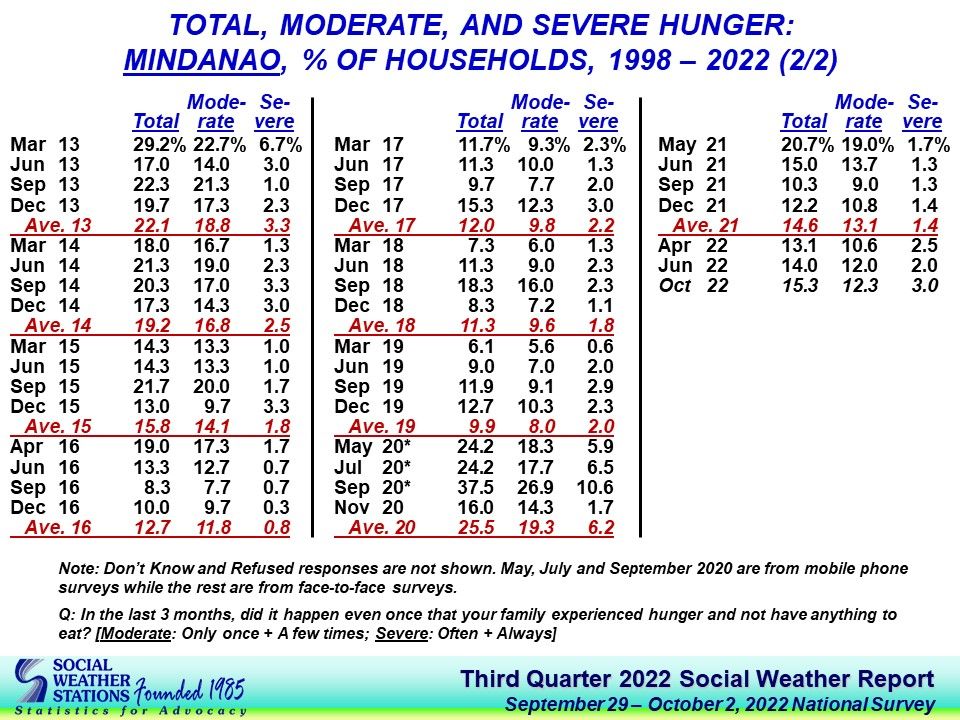
It also rose by 1.3 points in Mindanao, from 14.0% (est. 816,000 families) in June 2022 to 15.3% (est. 893,000 families) in October 2022.
Moderate Hunger 9.1%, Severe Hunger 2.2%
The 11.3% Hunger rate in October 2022 is the sum of 9.1% (est. 2.3 million families) who experienced Moderate Hunger and 2.2% (est. 573,000 families) who experienced Severe Hunger.
Moderate Hunger refers to those who experienced hunger “Only Once” or “A Few Times” in the last three months. Meanwhile, Severe Hunger refers to those who experienced it “Often” or “Always” in the last three months.
In June 2022, Moderate Hunger was 9.4% (est. 2.4 million families), and Severe Hunger was 2.1% (est. 546,000 families).
In Metro Manila, Moderate Hunger fell by 0.6 points from 11.3% in June 2022 to 10.7% in October 2022. However, Severe Hunger rose by 2.4 points from 3.3% to 5.7% [Chart 4, Table 3].
In Balance Luzon, Moderate Hunger fell by 1.3 points from 9.4% in June 2022 to 8.1% in October 2022, while Severe Hunger fell by 1.0 points from 2.5% to 1.5% [Chart 5, Table 4].
In the Visayas, Moderate Hunger rose by 1.3 points from 5.0% in June 2022 to 6.3% in October 2022, while Severe Hunger stayed at 0.7% [Chart 6, Table 5].
In Mindanao, Moderate Hunger rose by 0.3 points from 12.0% in June 2022 to 12.3% in October 2022, while Severe Hunger rose by 1.0 points from 2.0% to 3.0% [Chart 7, Table 6].
Hunger falls among the Self-Rated Non-Poor, but rises among the Self-Rated Poor
The October 2022 survey found 49% of Filipino families rating themselves as Mahirap or Poor, 29% rating themselves as Borderline (by placing themselves on a horizontal line dividing Poor and Not Poor), and 21% rating themselves as Hindi Mahirap or Not Poor (“Third Quarter 2022 Social Weather Survey: 49% of Filipino families feel Poor; 29% feel Borderline, 21% feel Not Poor,” October 20, 2022, www.sws.org.ph).
On the other hand, based on the type of food they eat, the October 2022 survey found 34% of families rating themselves as Food-Poor, 38% rating themselves as Food Borderline (by placing themselves on the horizontal line dividing Food-Poor and Not Food-Poor), and 28% rating themselves Not Food-Poor.
The rate of Overall Hunger (i.e., Moderate plus Severe) fell among the Non-Poor (Not Poor plus Borderline Poor), from 8.1% in June 2022 to 6.7% in October 2022. However, it rose slightly among the Self-Rated Poor, from 15.3% to 16.0% [Chart 8].
At the same time, the rate of Overall Hunger fell slightly among the Non-Food-Poor (Not Food-Poor plus Borderline Food-Poor), from 7.8% in June 2022 to 7.4% in October 2022. It hardly moved among the Self-Rated Food-Poor, from 19.0% to 18.9% [Chart 9].
Rates of hunger among the Self-Rated Food-Poor are always higher than rates of hunger among the Self-Rated Poor at any point in time.
Survey background
The Third Quarter 2022 Social Weather Survey was conducted from September 29 – October 2, 2022, using face-to-face interviews of 1,500 adults (18 years old and above) nationwide: 300 each in Metro Manila, the Visayas, and Mindanao, and 600 in Balance Luzon. Face-to-face is the standard interviewing method for Social Weather Stations; the only exceptions were early in the pandemic when movement restrictions made face-to-face impossible and mobile phone interviews were conducted. Normal face-to-face field operations resumed in November 2020. The sampling error margins are ±2.5% for national percentages, ±5.7% each for Metro Manila, the Visayas, and Mindanao, and ±4.0% for Balance Luzon.
The area estimates were weighted by the Philippine Statistics Authority medium-population projections for 2022 to obtain the national estimates.
The SWS survey questions on the family’s experience of Hunger, Self-Rated Poverty, and Self-Rated Food Poverty are directed to household heads. These items are non-commissioned and are included on SWS’s initiative and released as a public service.
Hunger. The exact phrasing of the survey questions (the source language is Filipino; English translation included) on Hunger was:
“Nitong nakaraang tatlong buwan, nangyari po ba kahit minsan na ang inyong pamilya ay nakaranas ng gutom at wala kayong makain? (OO, HINDI) [In the last three months, did it happen even once that your family experienced hunger and not have anything to eat? (YES, NO)].
“IF EXPERIENCED HUNGER: Nangyari po ba ‘yan ng MINSAN LAMANG, MGA ILANG BESES, MADALAS, o PALAGI? [Did it happen ONLY ONCE, A FEW TIMES, OFTEN, or ALWAYS?]”
Moderate Hunger refers to those who experienced hunger “Only Once” or “A Few Times” in the last three months, while Severe Hunger refers to those who experienced it “Often” or “Always” in the last three months.
Self-Rated Poverty and Self-Rated Food Poverty. In 2020, Self-Rated Poverty and Self-Rated Food Poverty were fielded only once because only in November 2020 was SWS able to resume face-to-face interviewing since the Covid-19 pandemic struck. Face-to-face interviewing is necessary for these questions since they require showing the respondents a card with the words MAHIRAP and HINDI MAHIRAP, separated by a LINE, written on it [Figure 1]. The three SWS Mobile Phone Surveys earlier that year implemented purely oral survey questions.
The exact phrasing of the survey questions for Self-Rated Poverty and Self-Rated Food Poverty was:
“Saan po ninyo ilalagay ang inyong pamilya sa kard na ito? [Where would you place your family in this card?] (SHOW CARD - DO NOT READ)
“Tungkol naman sa klase ng pagkain ng pamilya ninyo, saan po ninyo ilalagay ang inyong pamilya sa kard na ito? [Based on the type of food eaten by your family, where would you place your family on this card?] (SHOW CARD - DO NOT READ)”
Figure 1
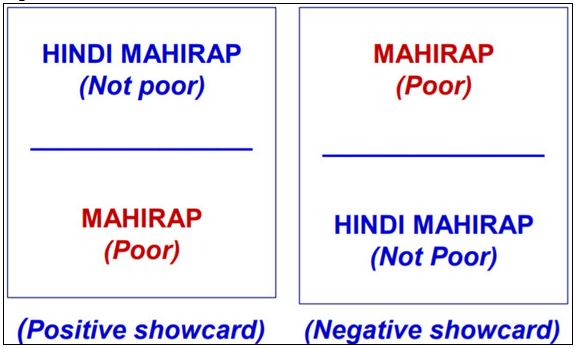
Half of the respondents are shown a card with the choices HINDI MAHIRAP (Not poor) and MAHIRAP (Poor), separated by a horizontal line (recorded as ‘Borderline Poor’), while the other half are shown a card containing the reverse order (negative showcard), to lessen response bias.
SWS employs its own staff for questionnaire design, sampling, fieldwork, data processing, and analysis, and does not outsource any of its survey operations. This report was prepared by Leo S. Laroza and Marvin R. Ipac.
Chart 1
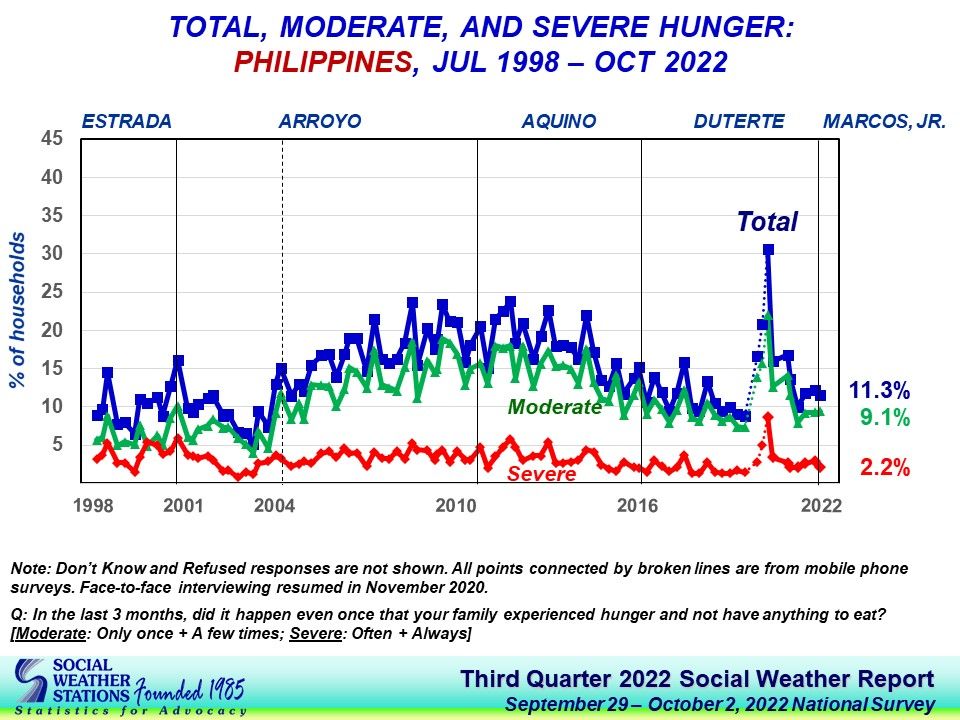
Chart 2
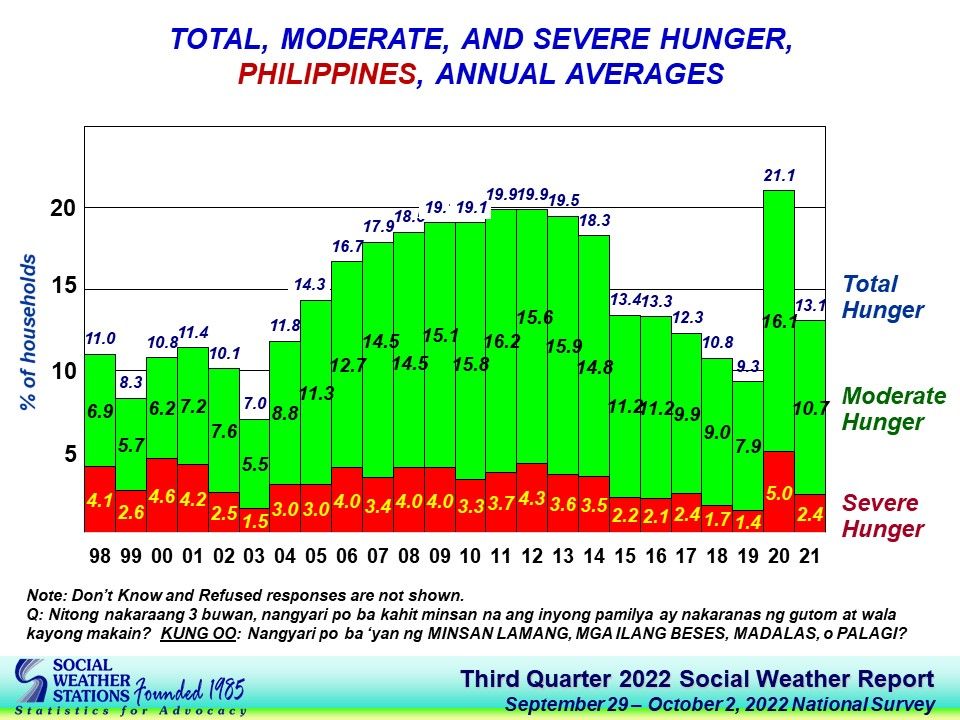
Chart 3
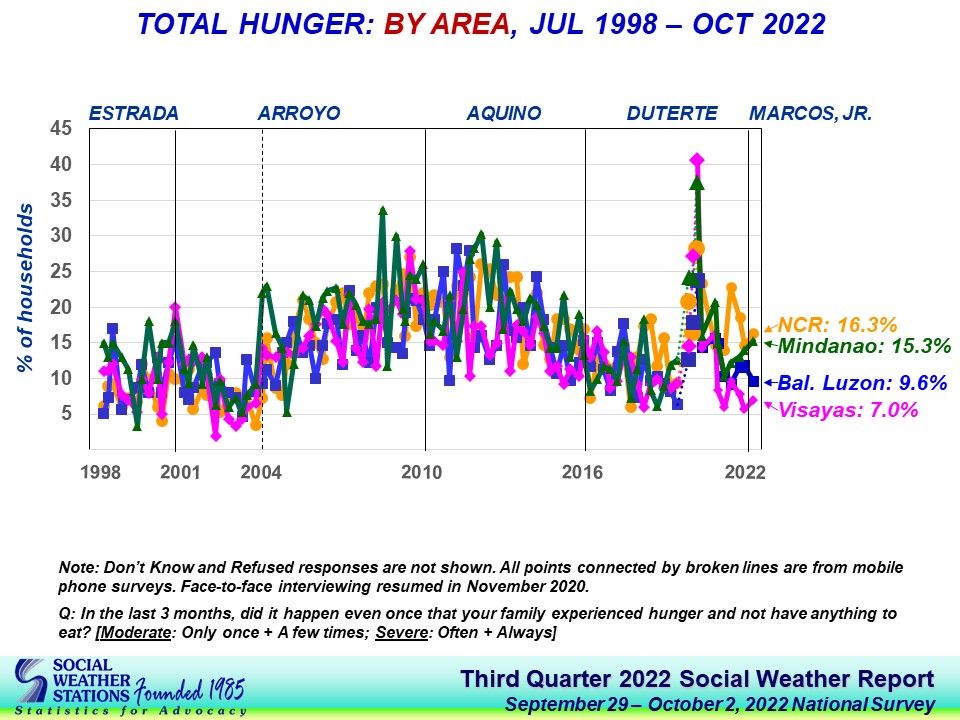
Chart 4
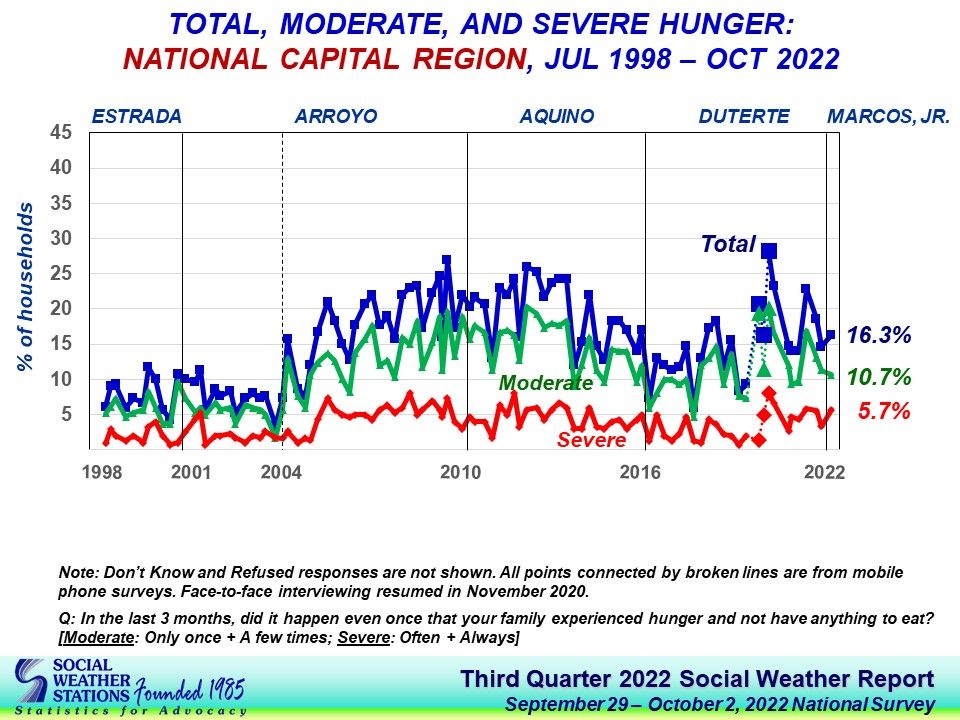
Chart 5
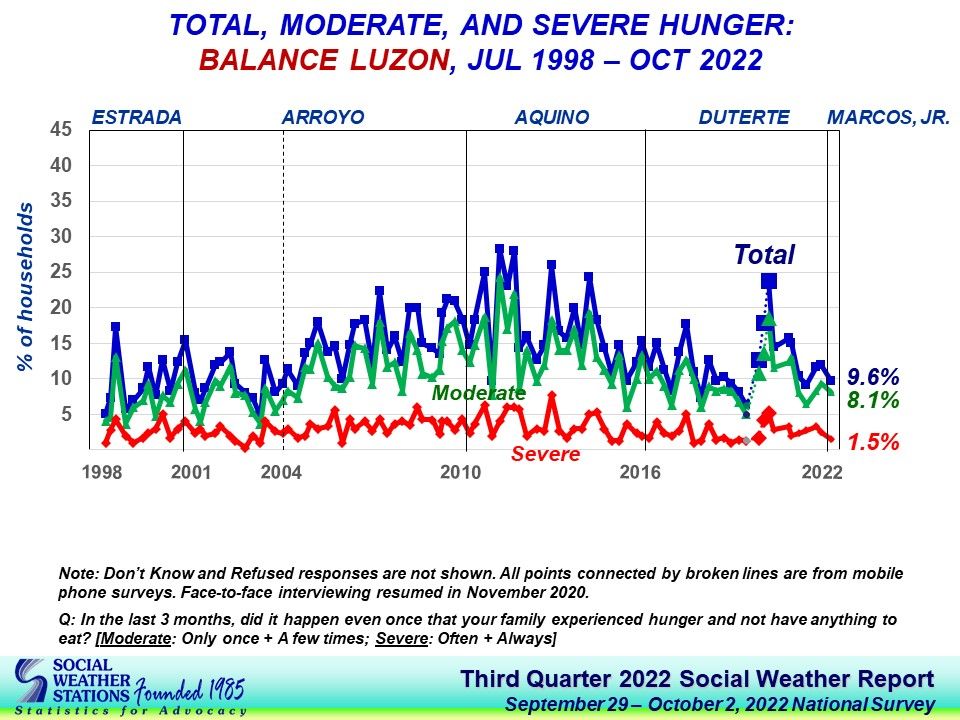
Chart 6
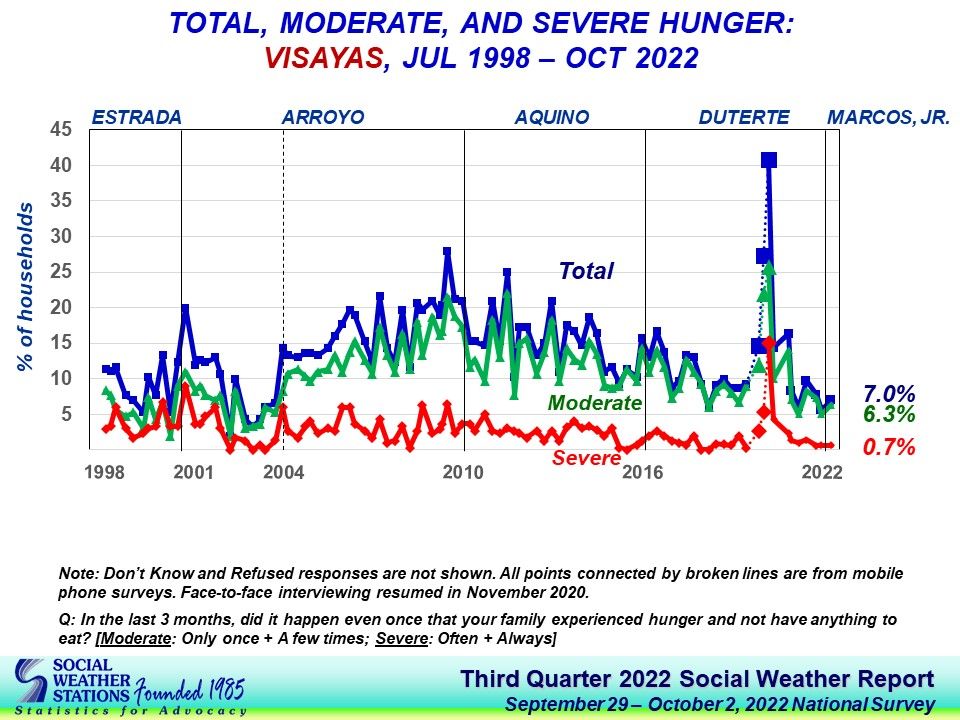
Chart 7
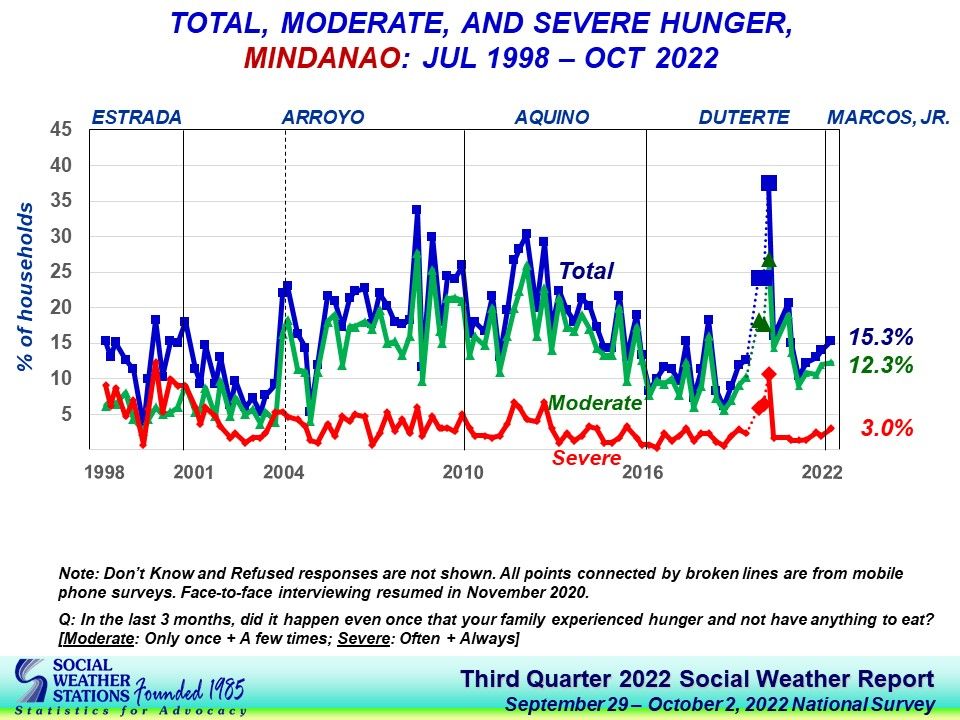
Chart 8
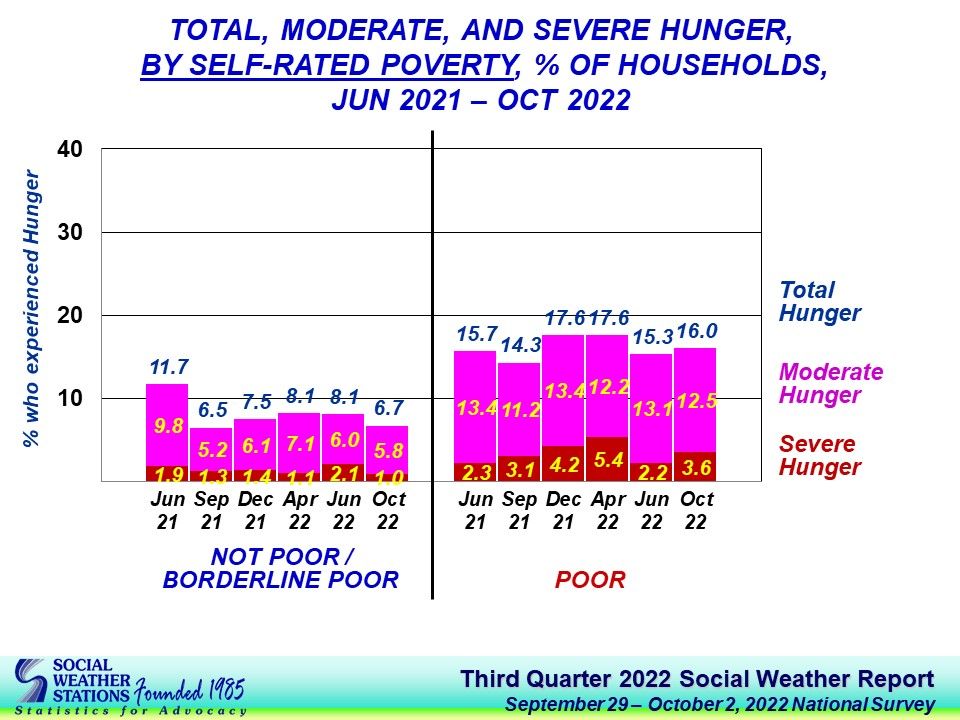
Chart 9

Table 1
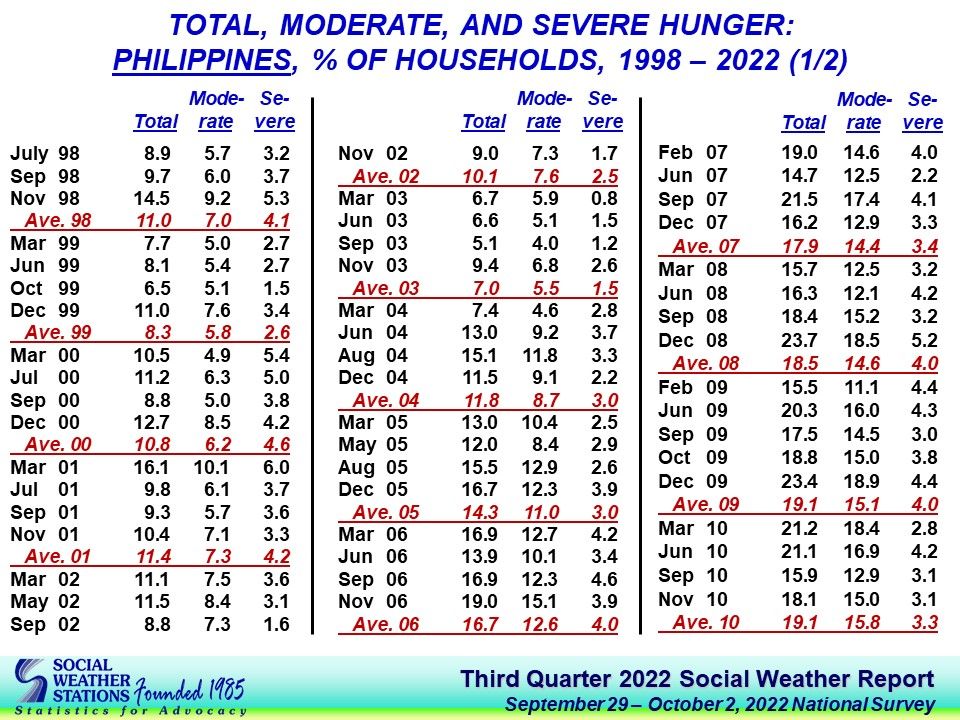
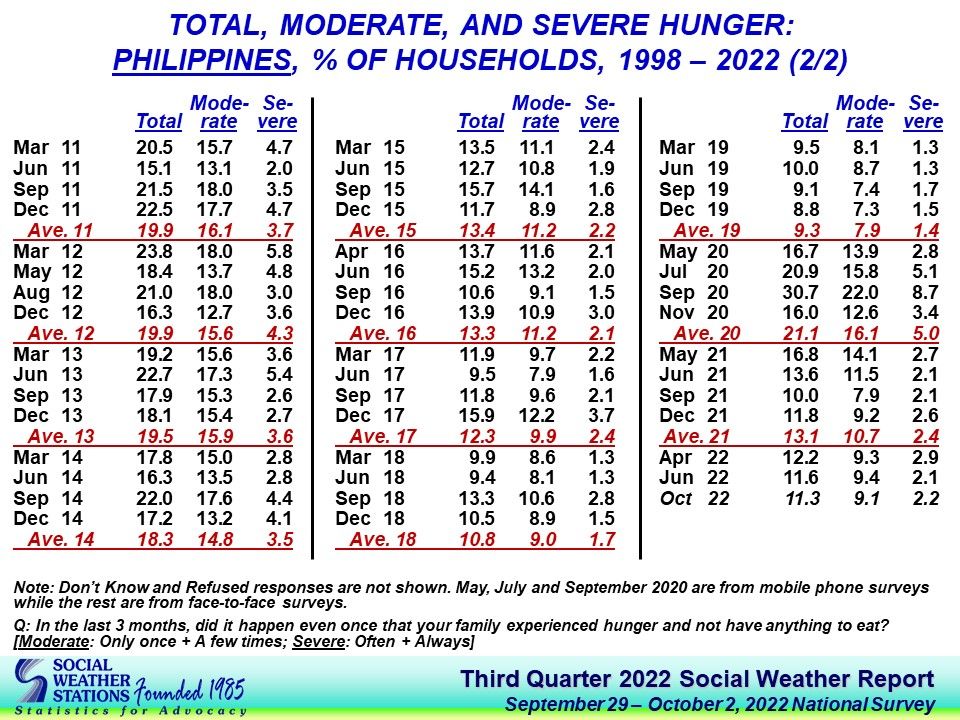
Table 2
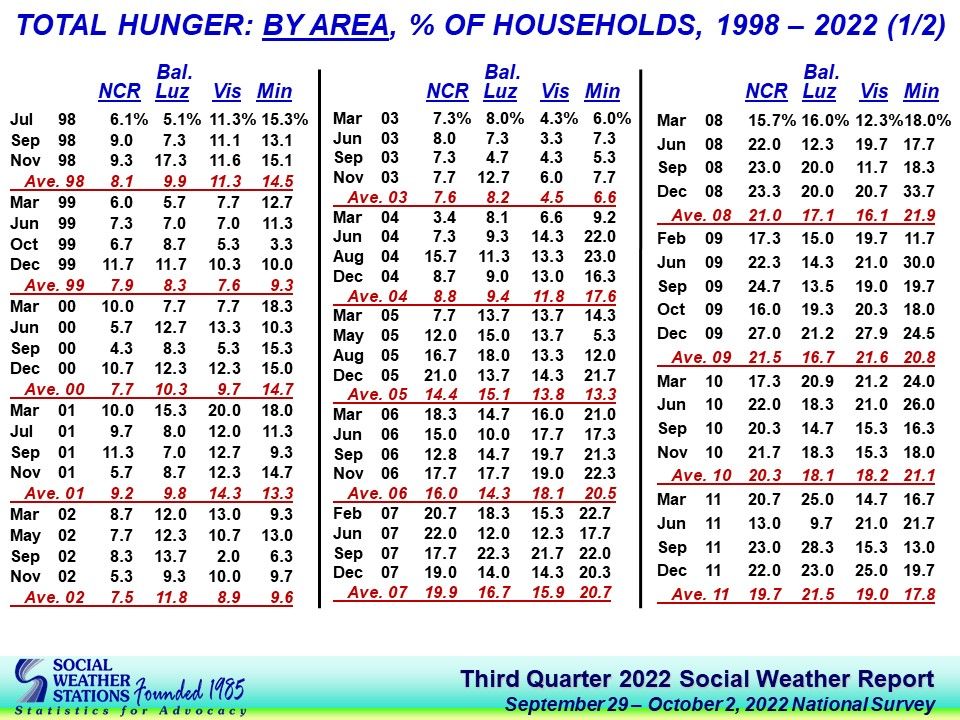
Table 3
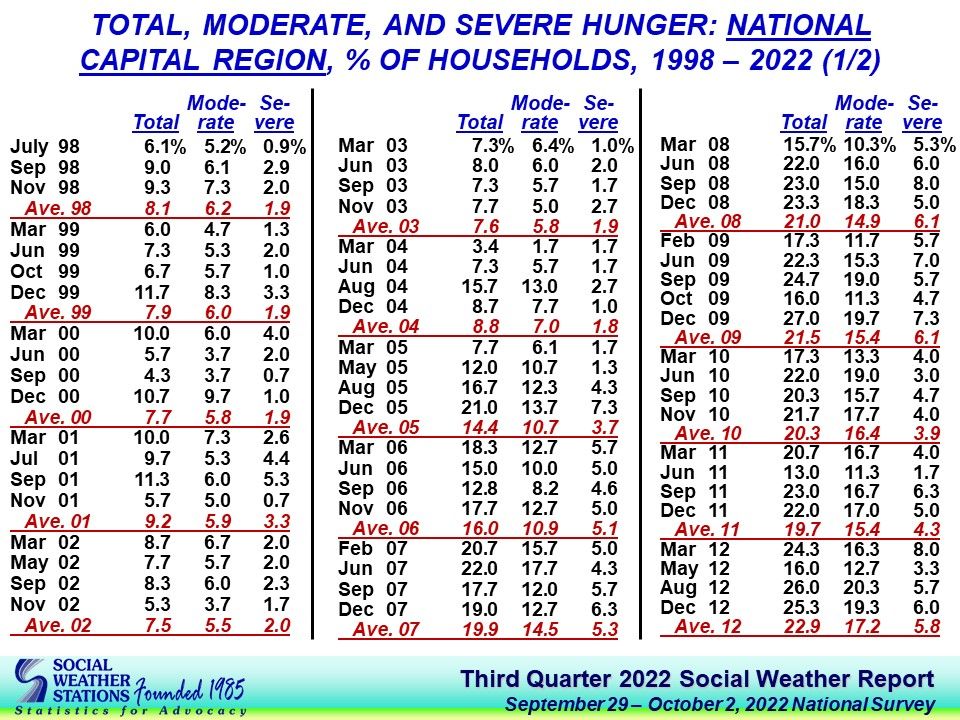
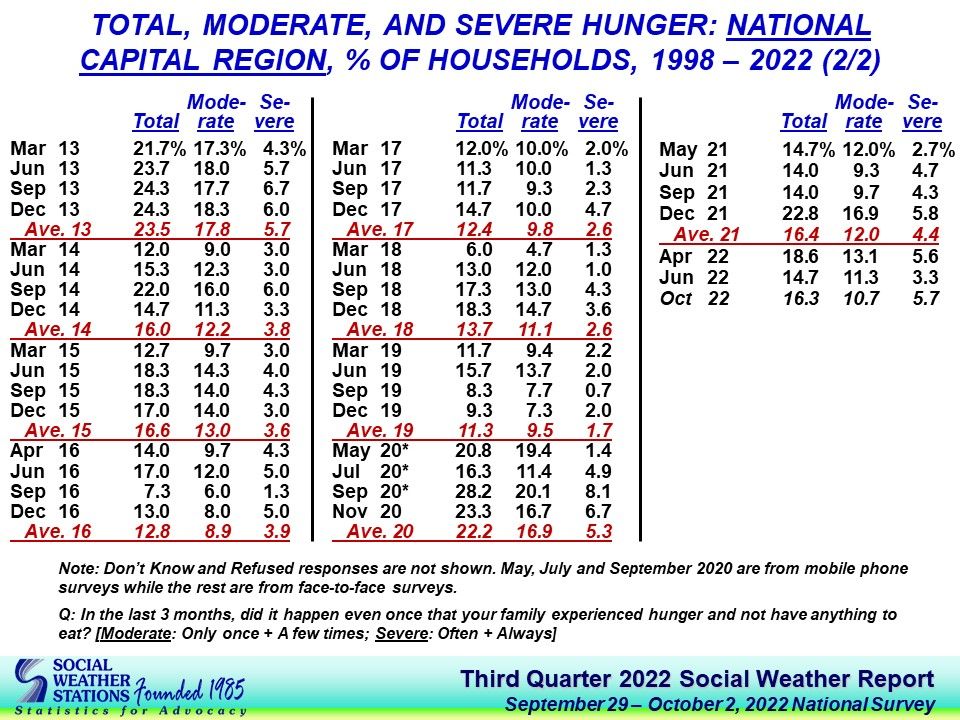
Table 4
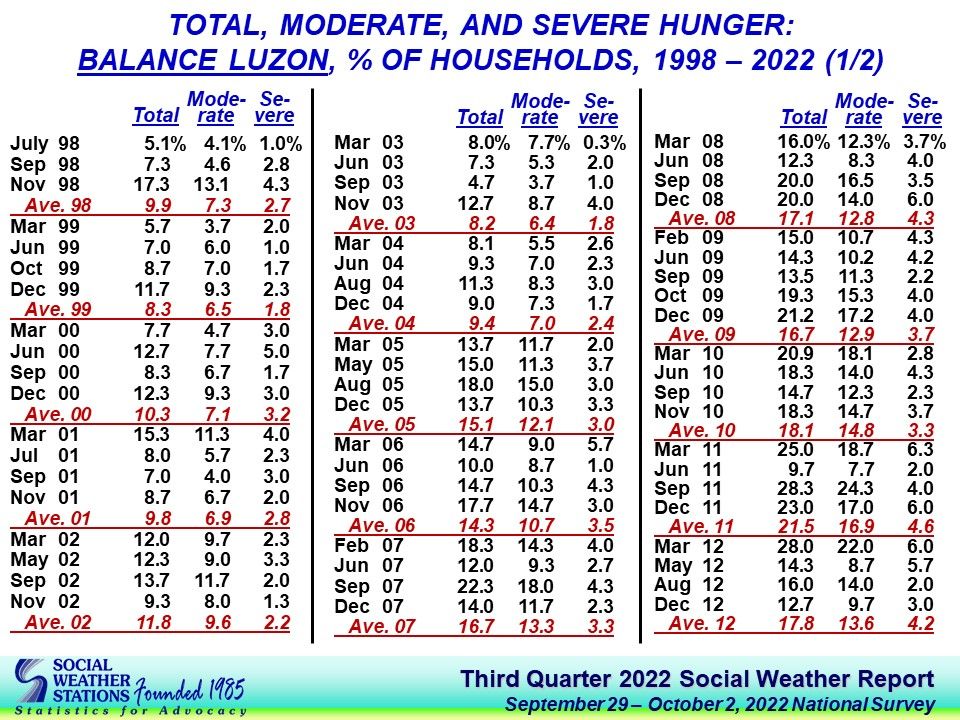
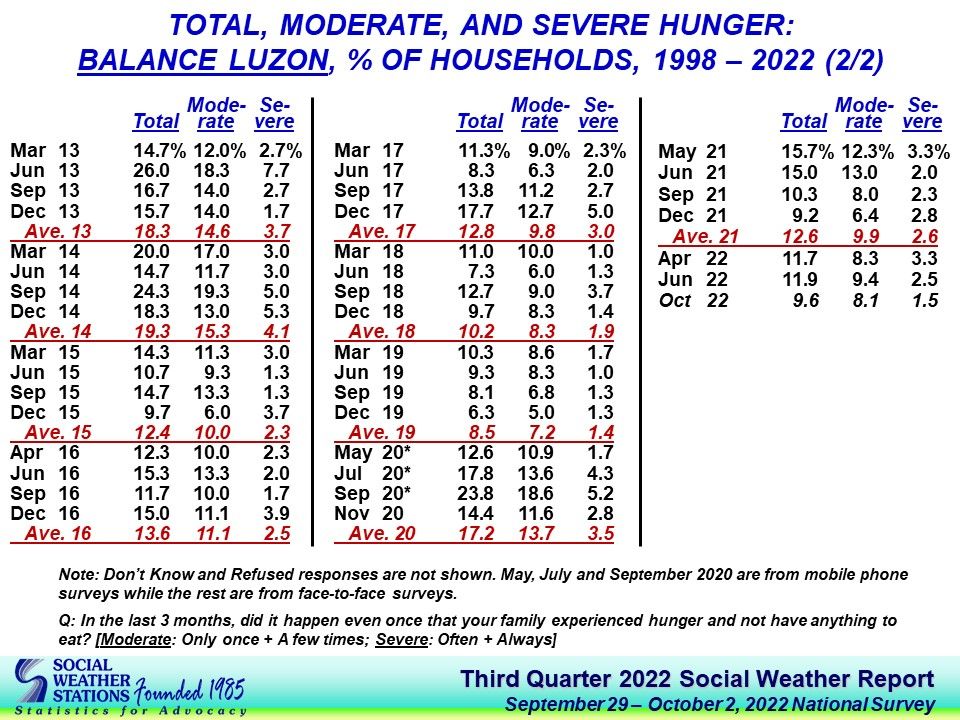
Table 5
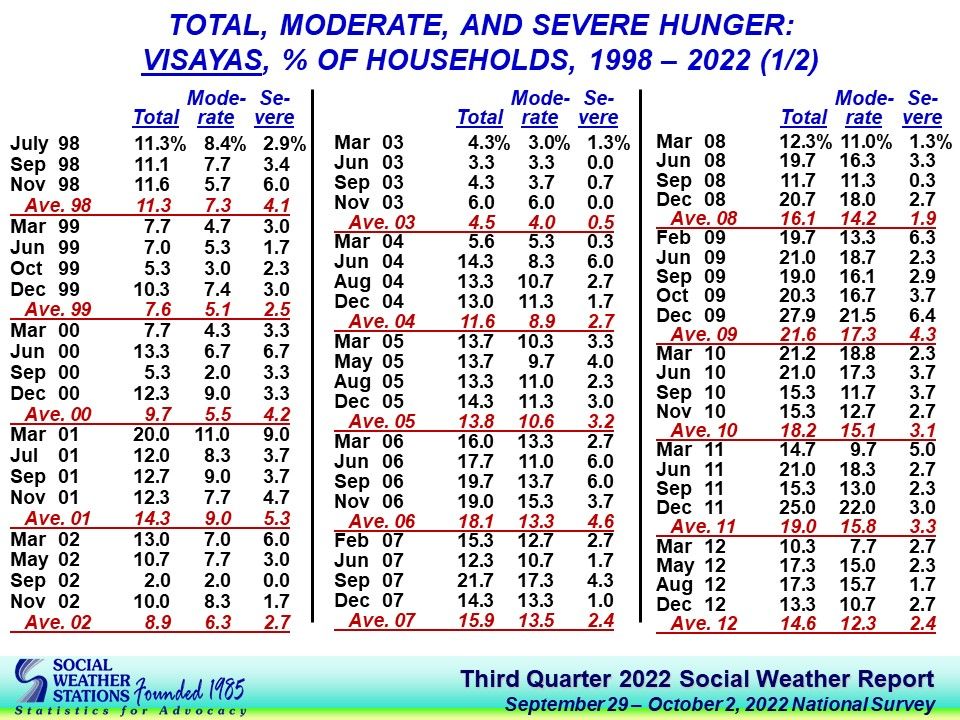
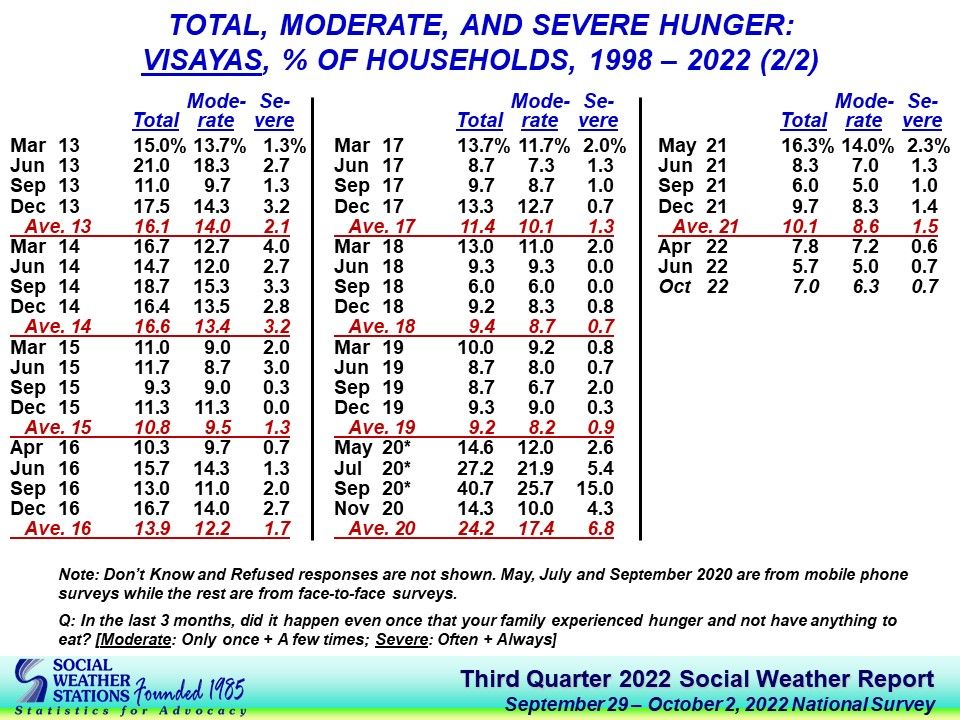
Table 6
If you liked what you just read and want more of Our Brew, subscribe to get notified. Just enter your email below.
Related Posts
Net satisfaction with the Marcos Administration fell to -13 in March 2026 from +14 in November 2025 - SWS
Jun 22, 2026
Massacre of Trees Under a Climate Crisis is Not Development — Greenpeace and NAPC-VDC
Jun 01, 2026
A Mass Killing in the Philippines Sparks Rare Scrutiny Over Counterinsurgency Violence – But No Wider Reckoning
May 31, 2026