By Social Weather Station
- Net Economic Optimism (Optimists minus Pessimists) at +40
The Social Weather Survey of April 19-27, 2022, the most recent quarterly national survey finalized by SWS, found 46% of adult Filipinos saying the Philippine Economy will improve (termed by SWS as “Economic Optimists”), 28% saying it will stay the same (“Neutral”), and 6% saying it will worsen (“Economic Pessimists”) in the next 12 months [Chart 1].
The resulting Net Economic Optimism score (% Economic Optimists minus % Economic Pessimists) is +40, classified by SWS as excellent (+40 and up).
The latest Net Economic Optimism score is 4 points below the excellent +44 in December 2021. It used to be mediocre -9 in July 2020, mediocre -5 in September 2020, and high +24 in November 2020, during the first year of the COVID-19 pandemic [Chart 2, Table 1].
Net Economic Optimism is different from Net Personal Optimism, which refers to expectations in personal quality-of-life.
The survey question on expectations for the general Philippine economy in the next 12 months has been fielded 90 times since September 1998.
Net Economic Optimism falls slightly in all areas except in the Visayas
As of April 2022, Net Economic Optimism is highest in Balance Luzon (or Luzon outside Metro Manila) (+46), followed by Metro Manila (+43), Mindanao (+43), and the Visayas (+18) [Chart 3, Table 2].
The 4-point decline in the national Net Economic Optimism score from December 2021 to April 2022 is due to slight decreases in all areas except in the Visayas.
Compared to December 2021, Net Economic Optimism stayed excellent in Balance Luzon, although down by 6 points from +52 to +46.
It stayed excellent in Metro Manila, although down by 4 points from +47 to +43.
It also stayed excellent in Mindanao, although down by 3 points from +46 to +43.
It stayed fair in the Visayas, hardly moving from +19 to +18.
Net Economic Optimism rises among non-elementary graduates
Net Economic Optimism varies somewhat by educational attainment. It is highest among those who either finished junior high school, had some vocational schooling, had some senior high school, finished senior high school, completed vocational school, or attended some college (or junior high school graduates) (+43), followed by those who either had no formal education or some elementary education (or non-elementary graduates) (+39), those who either finished elementary or had some high school education (or elementary graduates) (+37), and those who either graduated from college or took post-graduate studies (or college graduates) (+34) [Chart 4, Table 3].
Compared to December 2021, Net Economic Optimism fell from excellent to very high among college graduates, down by 16 points from +50 to +34.
It stayed excellent among junior high school graduates, although down by 2 points from +45 to +43.
It fell from excellent to very high among elementary graduates, down by 8 points from +45 to +37.
However, it rose from high to very high among non-elementary graduates, up by 10 points from +29 to +39.
Net Economic Optimism is directly related to Net Personal Optimism
The April 2022 survey found 44% of adult Filipinos saying their quality of life will improve (termed by SWS as “Optimists”), 39% saying it will stay the same (“No Change”), and 4% saying it will worsen (“Pessimists”), in the next 12 months. The remaining 13% did not give an answer (“First Quarter 2022 Social Weather Survey: 44% of adult Filipinos say their Quality-of-Life will improve in the next 12 months,” June 24, 2022, www.sws.org.ph).
Net Economic Optimism is higher among Personal Optimists (+63) than among those who said “No Change” (+31) and among Personal Pessimists (-35) [Chart 5].
Compared to December 2021, Net Economic Optimism stayed excellent among Personal Optimists, although down by 6 points from +69 to +63.
It rose from high to very high among those who said “No Change,” up by 5 points from +26 to +31.
It fell from very low to extremely low among Personal Pessimists, down by 13 points from
-22 to -35.
Higher Net Economic Optimism among Gainers than Losers
The April 2022 survey found 34% saying their quality of life was worse than twelve months before (termed by SWS as “Losers”), 32% saying it got better (“Gainers”), and 34% saying it was the same (“Unchanged”), compared to a year ago (“First Quarter 2022 Social Weather Survey: 34% of adult Filipinos got worse off in the past 12 months,” June 16, 2022, www.sws.org.ph).
Net Economic Optimism is higher among Gainers (+51) than among the Unchanged (+33) and Losers (+37) [Chart 6].
Compared to December 2021, Net Economic Optimism stayed at excellent +51 among Gainers [Chart 7].
It fell from excellent to very high among the Unchanged, down by 13 points from +46 to +33.
It stayed very high among Losers, hardly moving from +38 to +37.
Higher Net Economic Optimism among the Self-Rated Non-Poor than the Self-Rated Poor
The April 2022 survey also found 43% of Filipino families rating themselves as Mahirap or Poor, 34% rating themselves as Borderline Poor (by placing themselves on a horizontal line dividing Poor and Not Poor), and 23% rating themselves as Hindi Mahirap or Not Poor (“First Quarter 2022 Social Weather Survey: 43% of Filipino families feel Poor; 34% feel Borderline Poor, 23% feel Not Poor,” May 18, 2022, www.sws.org.ph).
Net Economic Optimism was +54 among adults who belong to families who consider themselves as Not Poor, compared to +39 among those who belong to families who consider themselves as Borderline Poor and +32 among those who belong to families who consider themselves as Poor [Chart 8].
Compared to December 2021, Net Economic Optimism stayed excellent among adults who belong to Self-Rated Not Poor families, up by 5 points from +49 to +54.
However, it fell from excellent to very high among adults who belong to Borderline Poor families, down by 5 points from +44 to +39.
It also fell from excellent to very high among adults who belong to Self-Rated Poor families, down by 9 points from +41 to +32.
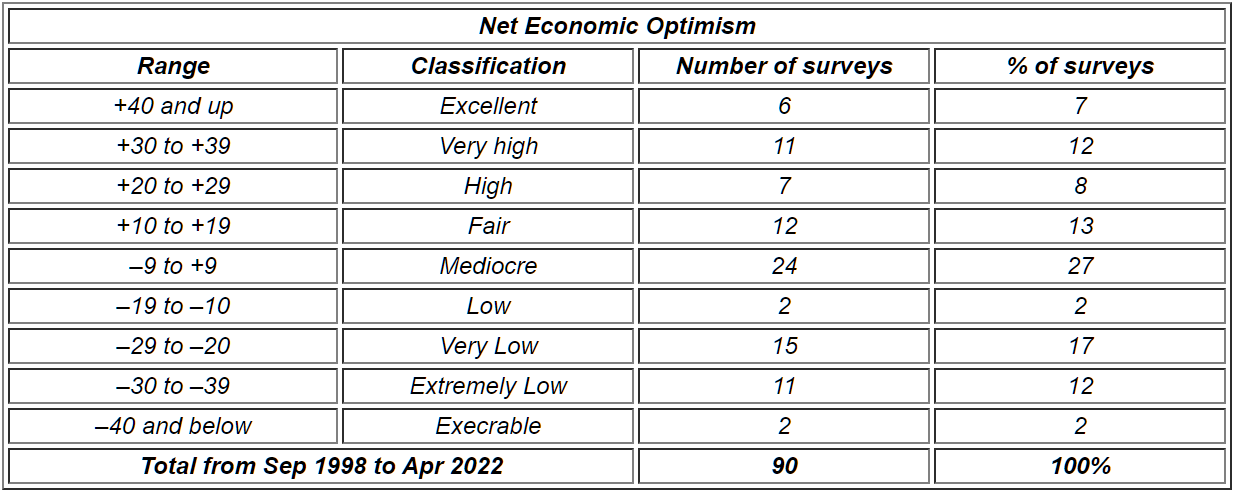
SWS classifications
The category “Excellent” is applied to Net Economic Optimism scores at +40 and above (7% of total observations); “Very High” to scores between +30 and +39 (12% of total observations); “High” to scores between +20 and +29 (8% of total observations); “Fair” to scores between +10 and +19 (13% of total observations); “Mediocre” to scores between –9 and +9
(27% of total observations); “Low” to scores between –19 and –10 (2% of total observations);
“Very Low” to scores between –29 and –20 (17% of total observations); “Extremely Low” to scores between –30 and –39 (12% of total observations); and “Execrable” to scores at –40 and below
(2% of total observations).
SWS considers a movement from one classification to another as either an upgrade or downgrade.
The historical distribution of Net Economic Optimism scores by grade is summarized in the table below:
Socio-demographic characteristics of respondents
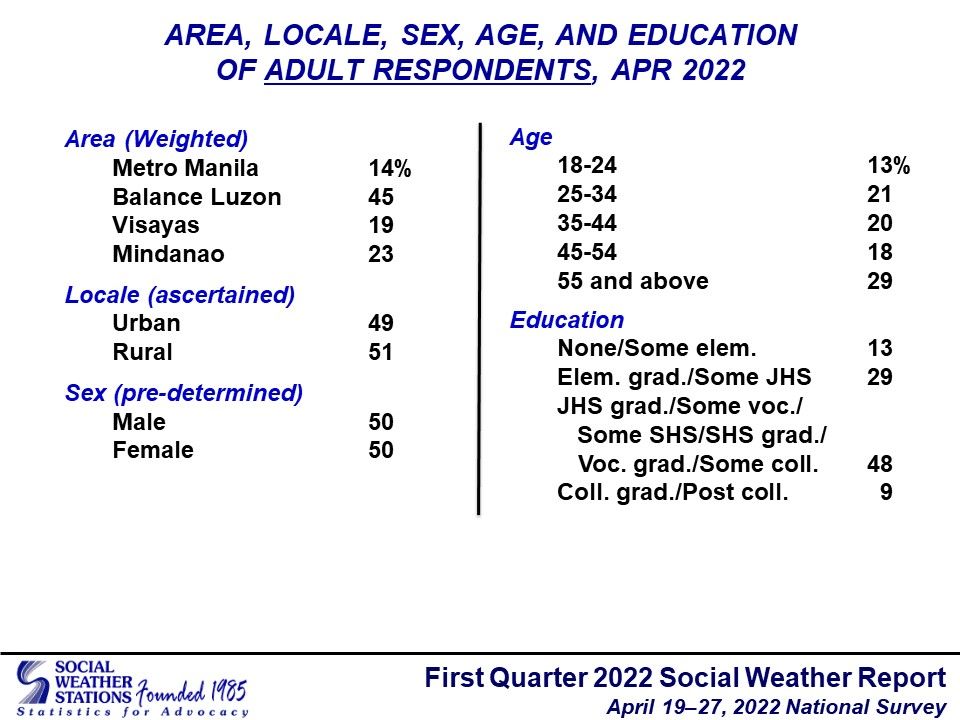
Applying census weights and correctly rounded, 14% of the respondents are from Metro Manila, 45% from Balance Luzon (or Luzon outside Metro Manila), 19% from the Visayas, and 23% from Mindanao [Table 4].
Forty-nine percent are from urban areas, and the balance of 51% are from rural areas.
The male:female ratio is 1:1 due to deliberate alternate sampling of men and women in the field.
By age group, 13% are youth (18-24), 21% are intermediate youth (25-34), 20% are middle-aged (35-44), 18% are 45 to 54 years old, and 29% are 55 years old and above.
By education, 13% had at most some elementary education, 26% either finished elementary or had some high school education, 48% either finished junior high school, had some vocational schooling, had some senior high school, finished senior high school, completed vocational school, or attended some college, and 13% either graduated from college or took post-graduate studies.
Survey background
The First Quarter 2022 Social Weather Survey was conducted from April 19-27, 2022, using face-to-face interviews of 1,440 adults (18 years old and above) nationwide: 360 each in Balance Luzon, Metro Manila, the Visayas, and Mindanao. Face-to-face is the standard interviewing method for Social Weather Stations; the only exceptions were early in the pandemic when movement restrictions made face-to-face impossible and mobile phone interviews were conducted. Normal face-to-face field operations resumed in November 2020. The sampling error margins are ±2.6% for national percentages and ±5.2% for Balance Luzon, Metro Manila, the Visayas, and Mindanao.
The area estimates were weighted by the Philippine Statistics Authority medium-population projections for 2022 to obtain the national estimates.
The survey items reported here were non-commissioned. They were done on SWS’s own initiative and released as a public service.
The exact phrasing of the survey questions (the source language is Filipino; English translation included) was:
On Expected Change in Philippine Economy in the next 12 months: “Sa darating na 12 buwan, ano sa palagay ninyo ang mangyayari sa ekonomiya ng Pilipinas? Masasabi ba ninyo na ito ay BUBUTI, KAPAREHO LANG, o SASAMA? [Over the next 12 months, what do you think will happen to the economy of the Philippines? Would you say it WILL BE BETTER, SAME, or WILL BE WORSE?]”
On Expected Change in Personal Quality-of-life in the next 12 months: “Sa inyong opinyon, ano ang magiging uri ng inyong pamumuhay sa darating na 12 buwan? Masasabi ba ninyo na ang uri ng inyong pamumuhay ay BUBUTI, KAPAREHO LANG, o SASAMA? [In your opinion, what will be the quality of your life in the coming 12 months? Would you say that your quality of life WILL BE BETTER, SAME, or WILL BE WORSE?]”
On Change in Personal Quality-of-life from a year ago to the present: “Kung ikukumpara ang uri ng inyong kasalukuyang pamumuhay sa nakaraang 12 buwan, masasabi ba ninyo na ang uri ng inyong pamumuhay ay MAS MABUTI KAYSA NOON, KAPAREHO NG DATI, o MAS MASAMA KAYSA NOON? [Comparing your quality of life these days to how it was 12 months ago, would you say that your quality of life is BETTER NOW THAN BEFORE, SAME AS BEFORE, or WORSE NOW THAN BEFORE?]”
On Self-Rated Poverty: “Saan po ninyo ilalagay ang inyong pamilya sa kard na ito? [Where would you place your family in this card?] (SHOW CARD - DO NOT READ) (Figure 1)”
Figure 1. Self-Rated Poverty Showcard
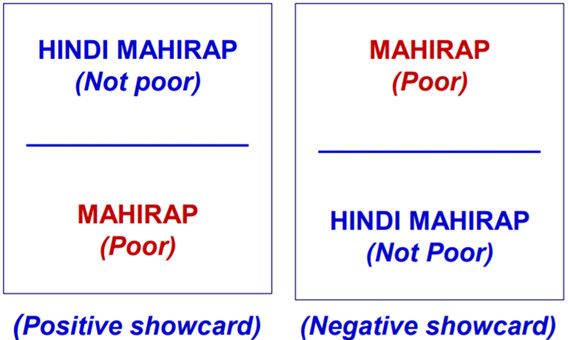
Half of the respondents are shown a card with the choices HINDI MAHIRAP (Not poor) and MAHIRAP (Poor), separated by a horizontal line (recorded as ‘Borderline Poor’), while the other half are shown a card containing the reverse order (negative showcard), to lessen response bias.
SWS employs its own staff for questionnaire design, sampling, fieldwork, data processing, and analysis, and does not outsource any of its survey operations. This report was prepared by Leo S. Laroza and Marvin R. Ipac.
Chart 1
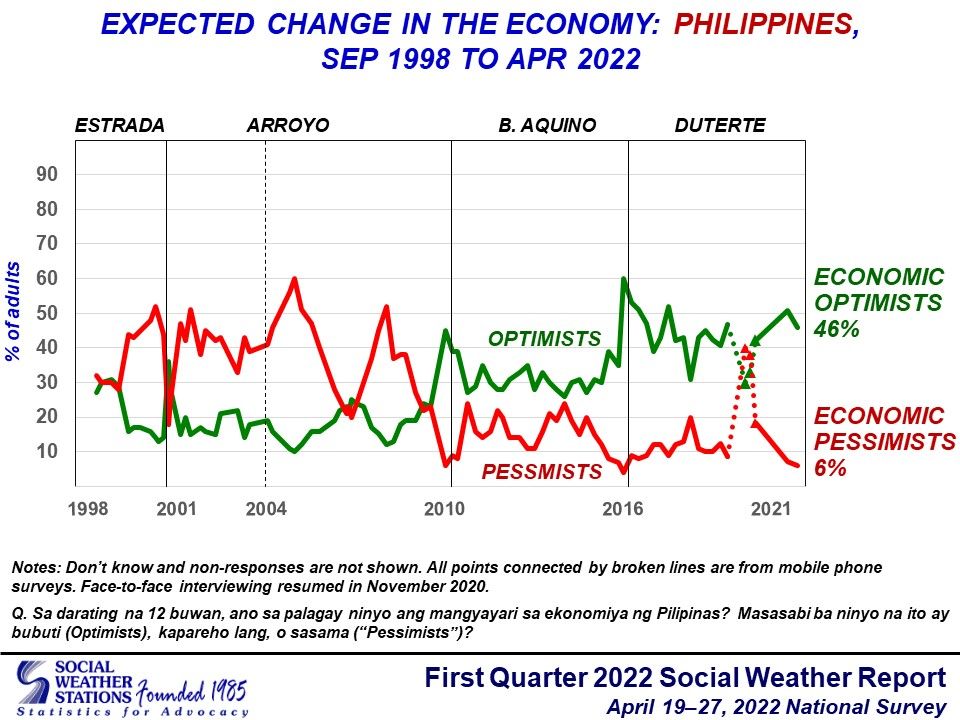
Chart 2
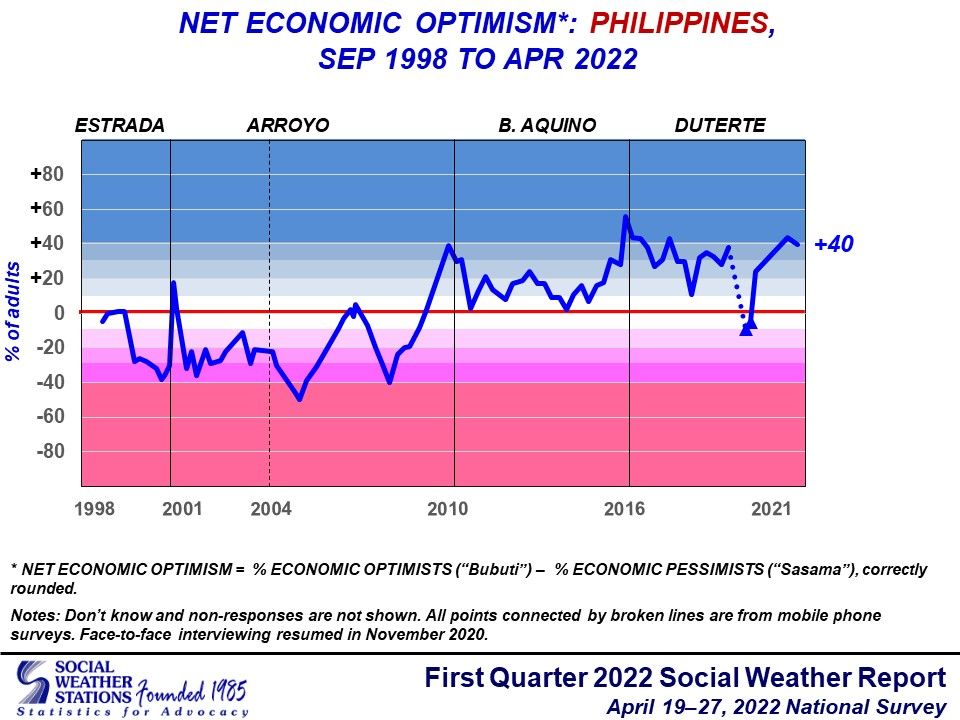
Chart 3
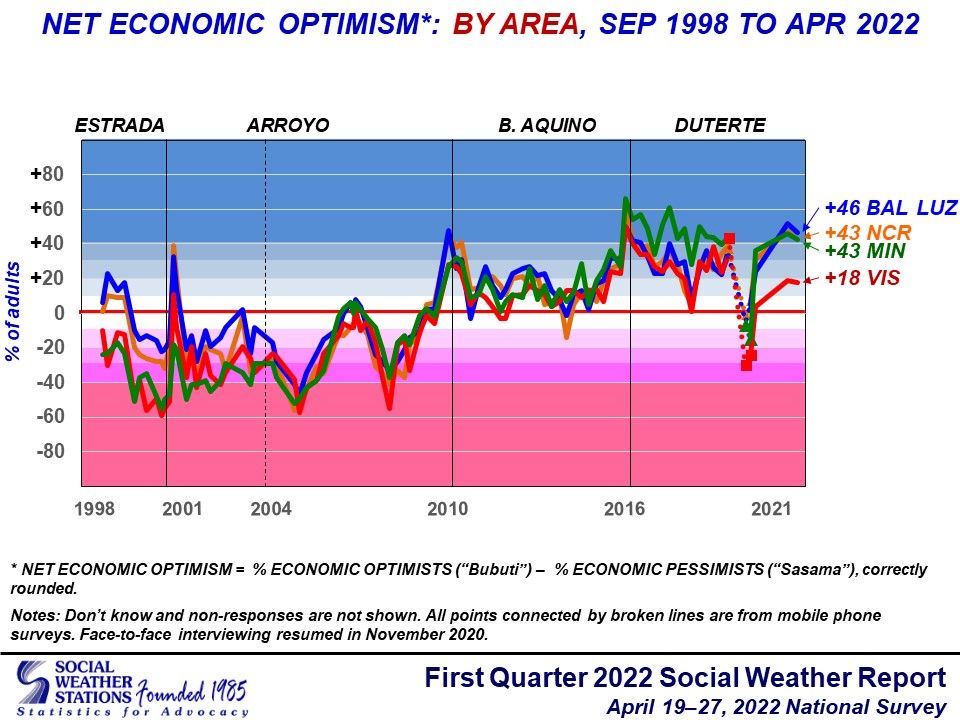
Chart 4
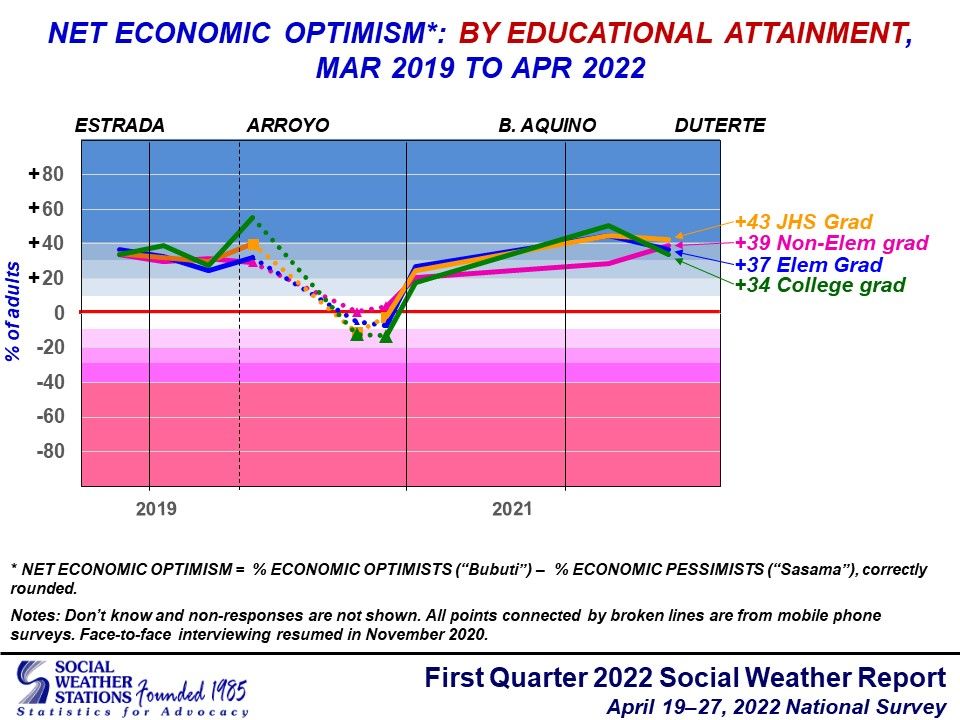
Chart 5
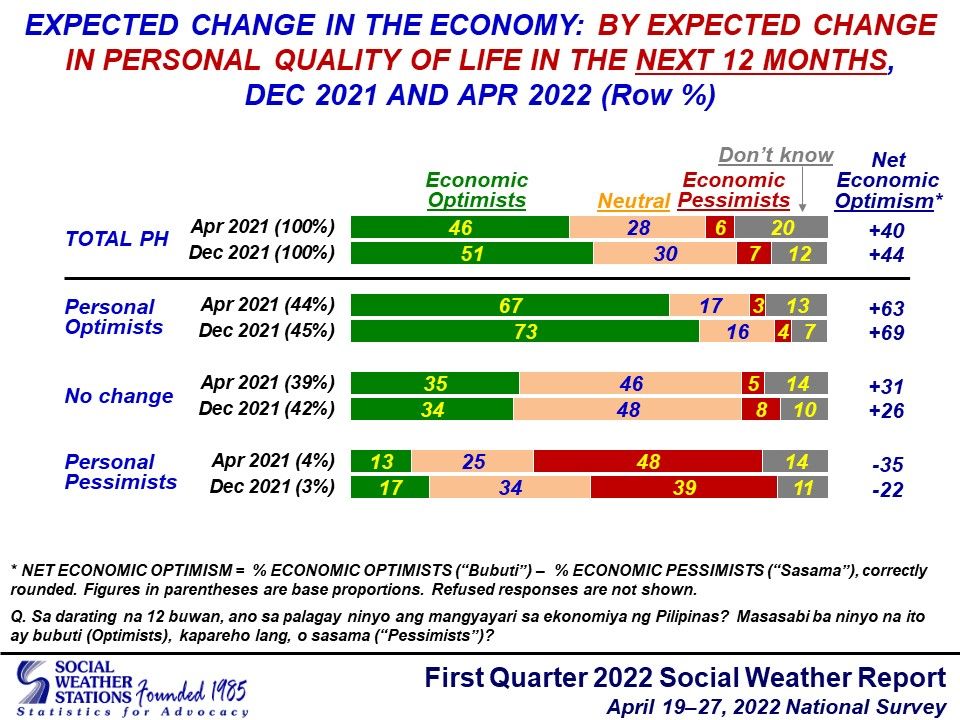
Chart 6
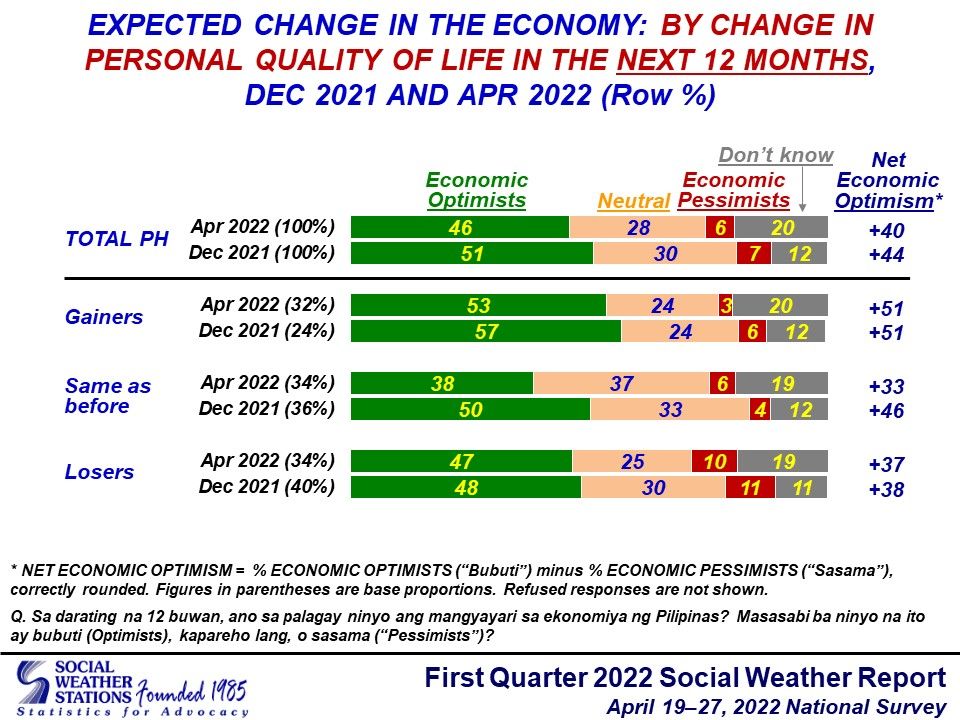
Chart 7
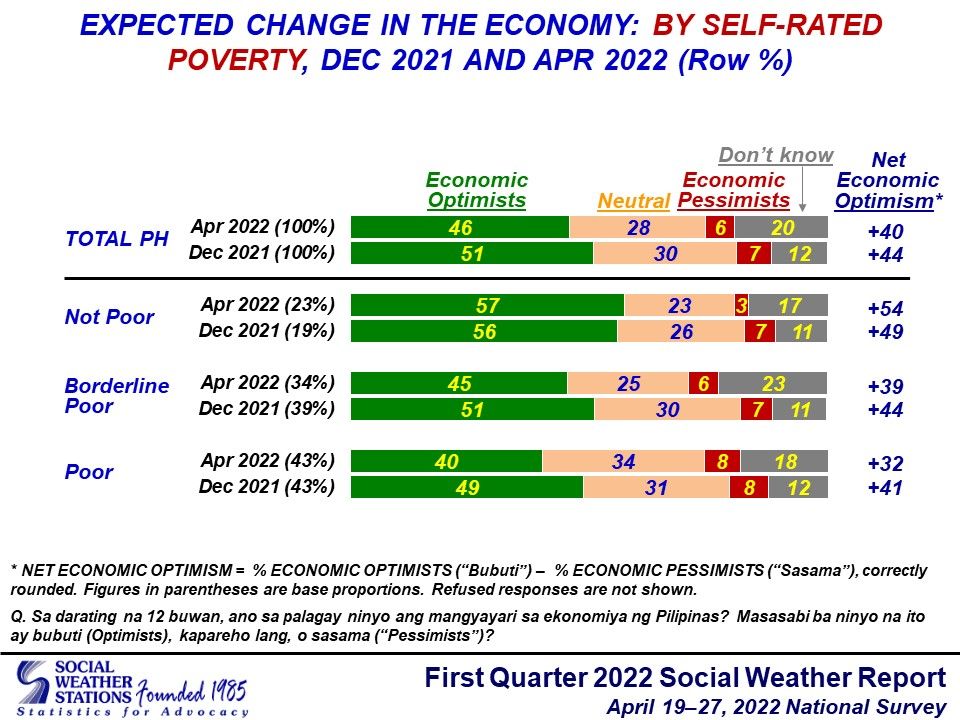
Table 1
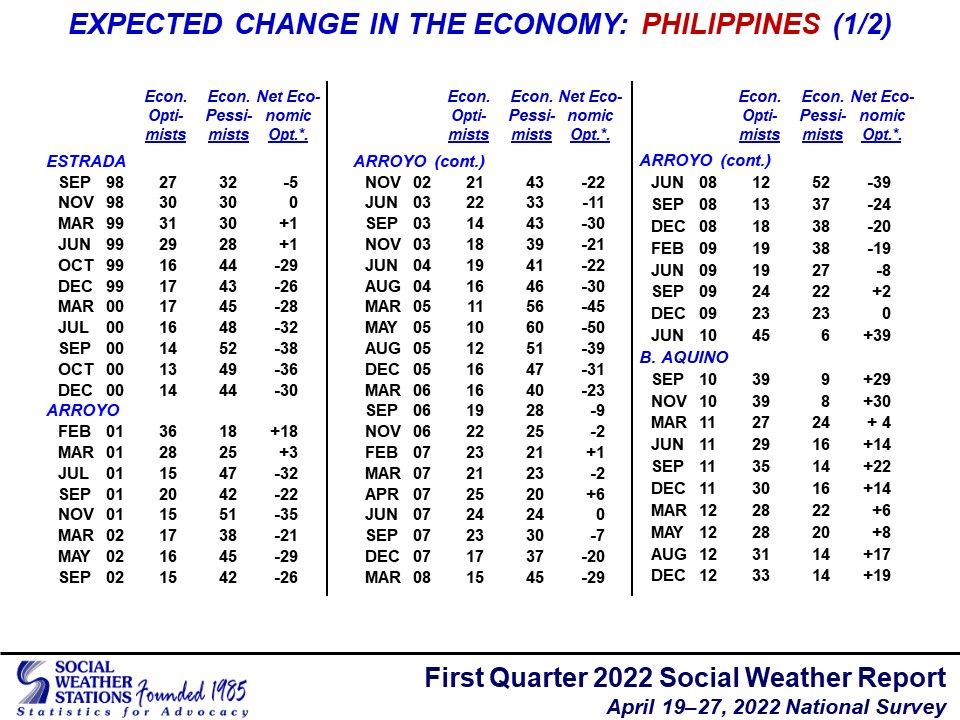
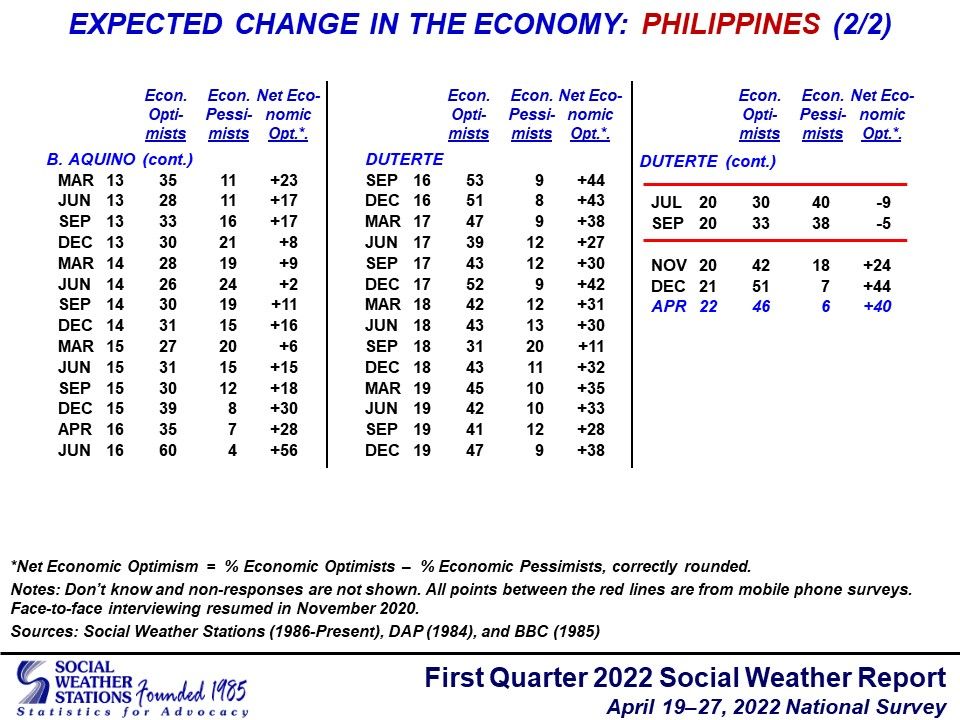
Table 2
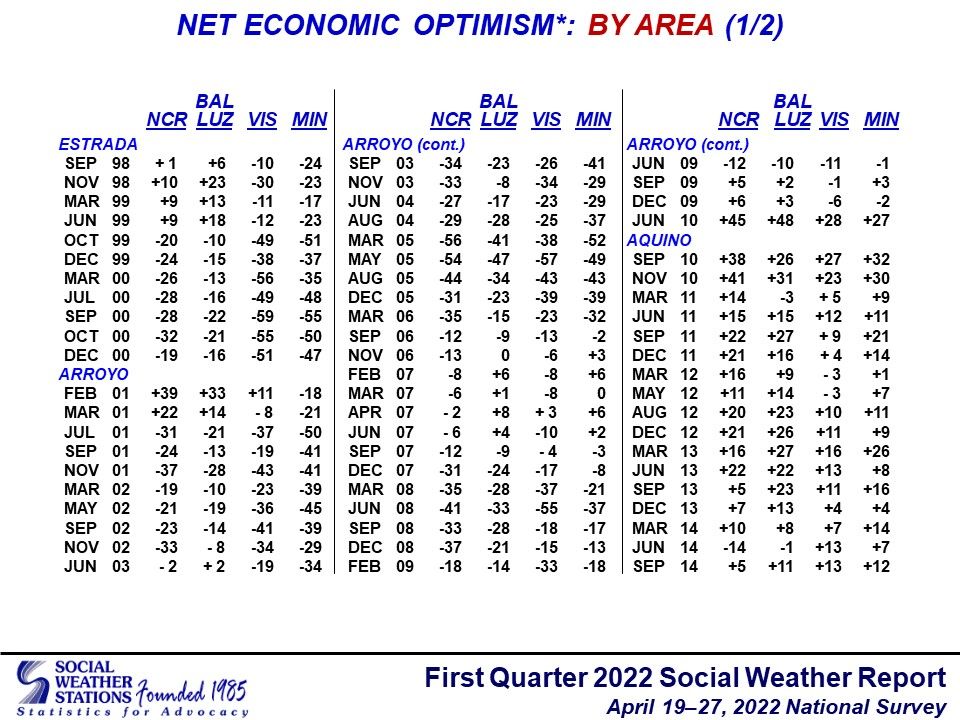
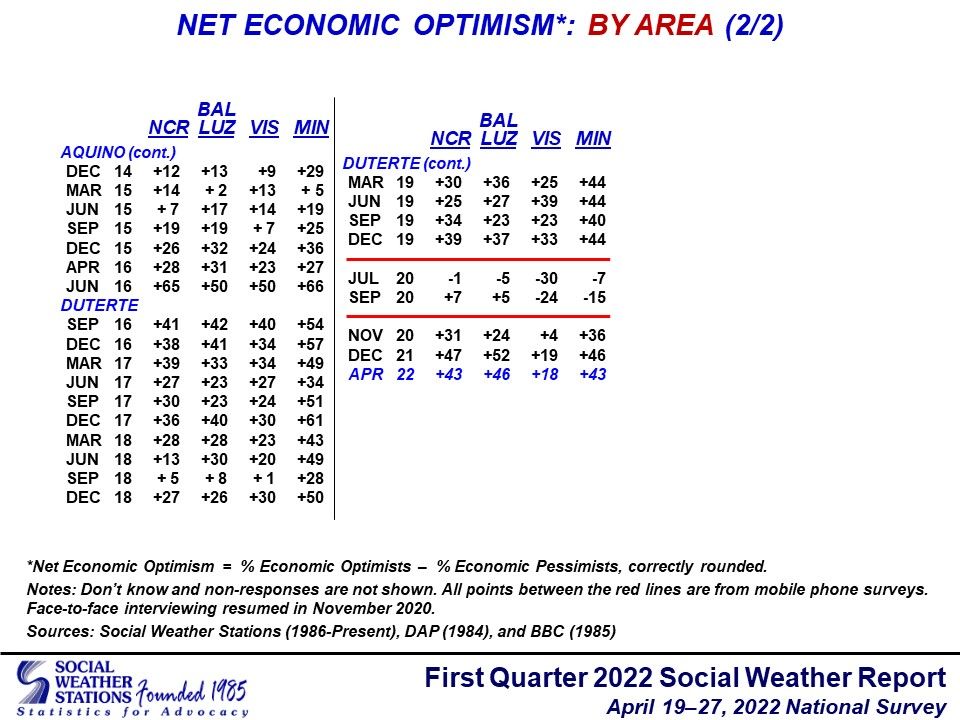
Table 3
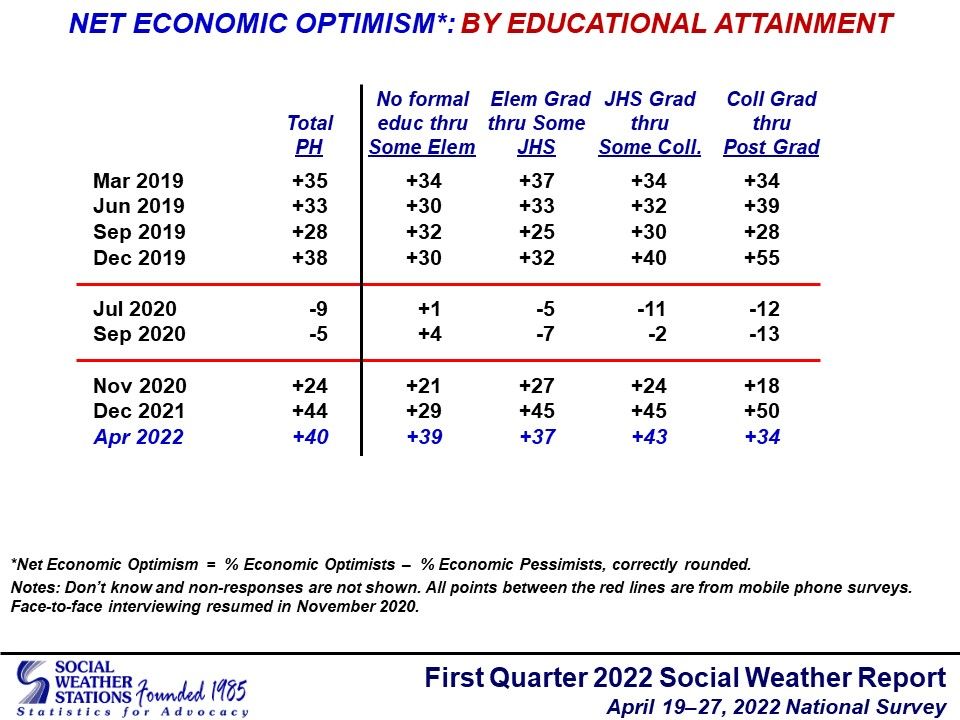
Table 4
If you liked what you just read and want more of Our Brew, subscribe to get notified. Just enter your email below.
Related Posts
Net satisfaction with President Ferdinand Marcos, Jr. falls from -3 in November 2025 to -15 in March 2026 - SWS
May 28, 2026
Why Swedish Schools Are Bringing Back Books
Apr 17, 2026
Science Literacy Gone Viral
Apr 16, 2026